Platform

AnalysesDataLabs

Integrations

Storage and lab systemsAI agents

Company

Security

Resources

DocsDeployment

Account

Log inSign up

Run any analysis without writing code.

26 kinds of sequencing data, from raw files to figures.
PBMC, IFN-β vs controlSingle-cell RNA-seq21,216 cells
Cell types
Reference: PBMC
PlotTableCodeLineage
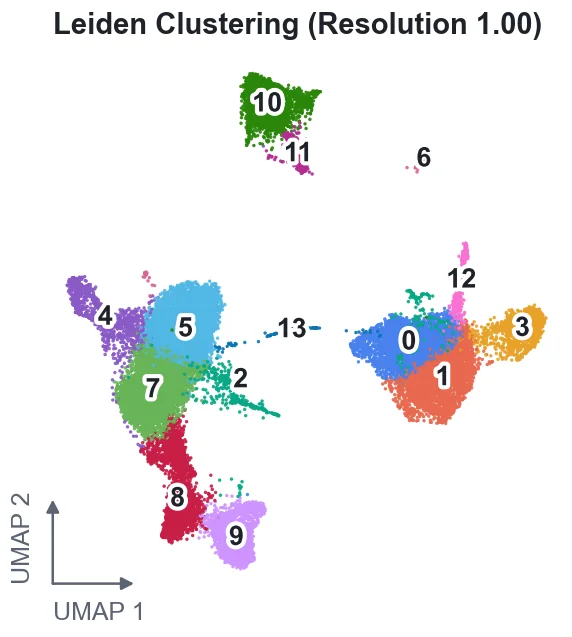
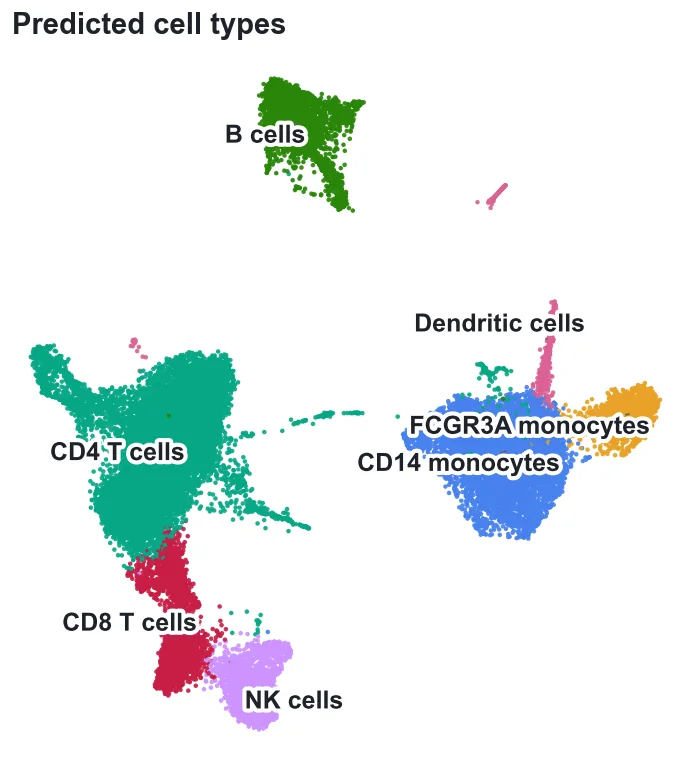
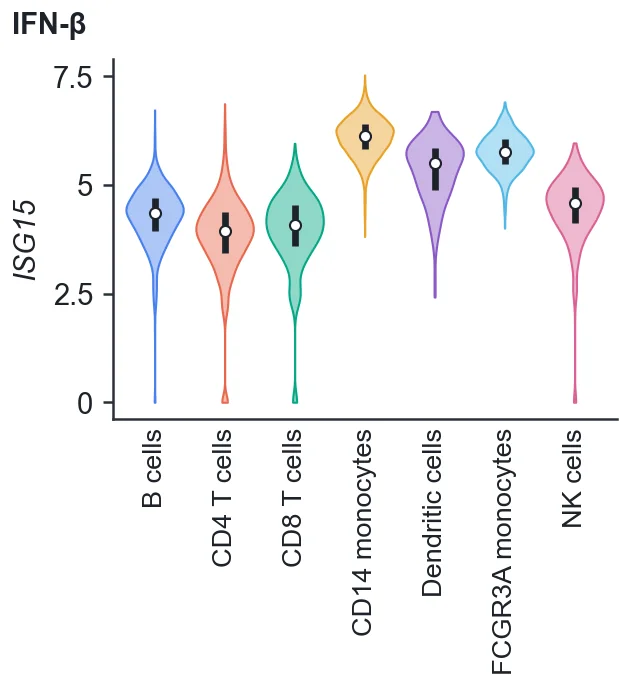
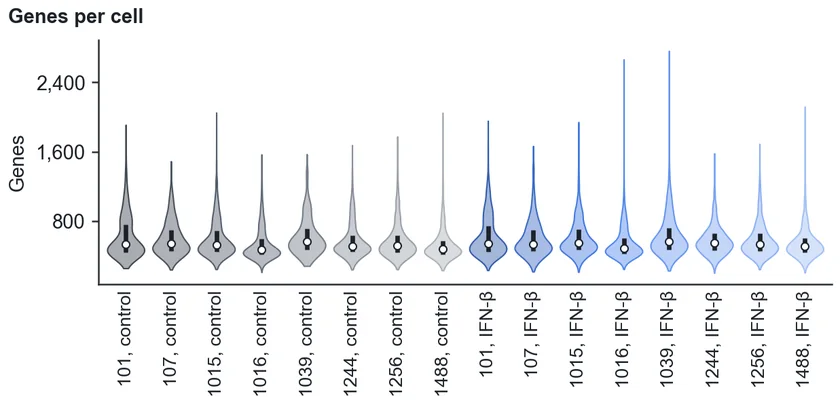
Violin plots of genes per cell in each sample UMAP of PBMCs coloured by Leiden cluster, resolution 1.0 UMAP of PBMCs coloured by predicted cell type Violin plots of ISG15 expression by cell type with IFN-β
7 cell types
Steps 4
  1. Violin plots of genes per cell in each sampleQuality controlStep 1
  2. UMAP of PBMCs coloured by Leiden cluster, resolution 1.0ClusteringStep 2
  3. UMAP of PBMCs coloured by predicted cell typeCell typesStep 3
  4. Violin plots of ISG15 expression by cell type with IFN-βCompare conditionsStep 4

Every kind of sequencing data.

Transcriptomics

Bulk RNA-seqSingle-cell RNA-seqSmart-seq2Small RNA-seqSpatial transcriptomicsDual RNA-seqBacterial RNA-seq

Chromatin

ATAC-seqSingle-cell ATAC-seqChIP-seqCUT&TagCUT&RUNHi-C

Immune repertoires

TCR repertoiresBCR repertoiresSingle-cell TCRSingle-cell BCR

Multi-omics

CITE-seqMultiomePerturb-seq

Screens and editing

CRISPR screensCRISPR amplicon sequencingGUIDE-seqTn-seq fitness screens

Proteins and cells

ProteomicsFlow cytometry

Start from raw files.

Counted on arrival.

ReadsHuman · GRCh38
LPS_1_R1.fastq.gz2.1 GB
LPS_1_R2.fastq.gz2.1 GB
Ctrl_1_R1.fastq.gz1.9 GB
12 samples counted

Pick a step. It runs.

Every analysis is a search away.

Differential expression DESeq2
Gene set enrichment GSEA
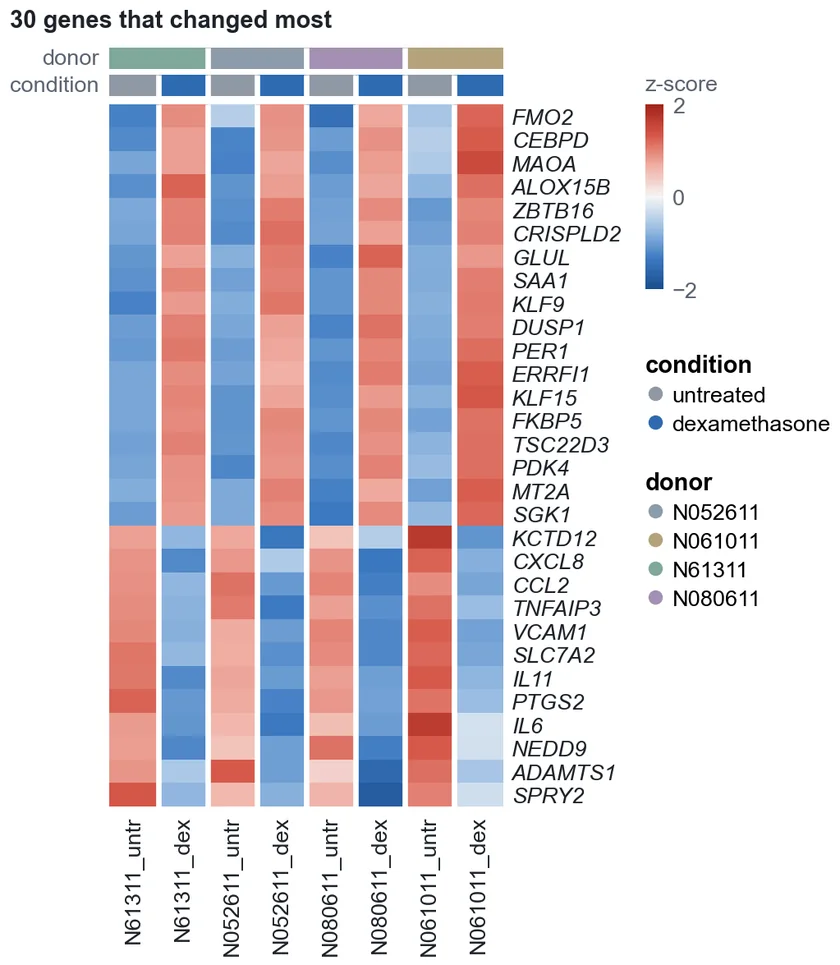
Heatmap Top genes
Differential expressionDone
Heatmap of the 30 genes that changed most with dexamethasone in airway cells

Click any gene.

See what it does and where else it moved.
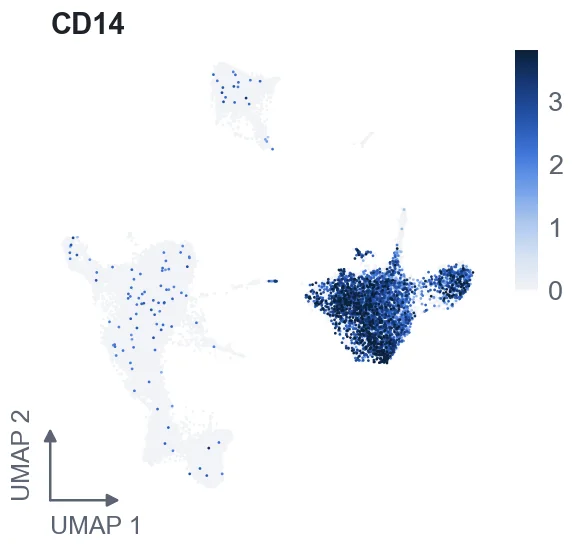
CD142.31
LYZ2.07
S100A81.94
FCGR3A1.62
ISG151.48
CD14
Monocyte marker
UMAP of PBMCs coloured by CD14 expression In 3 of your analyses

Figures ready for the paper.

Combine plots from any analysis into one figure.
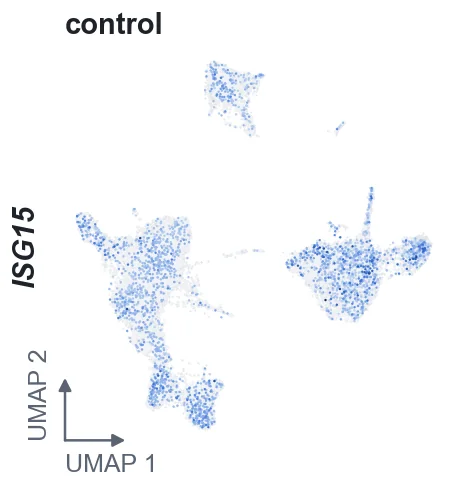
Figure 2 · IFN-β responseExport
AUMAP of PBMCs coloured by predicted cell type
BViolin plots of ISG15 expression by cell type with IFN-β
CUMAP of ISG15 expression in control PBMCs
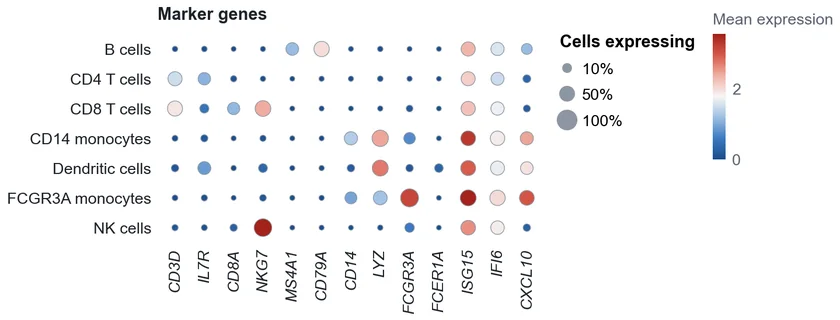
DDot plot of marker genes across PBMC cell types
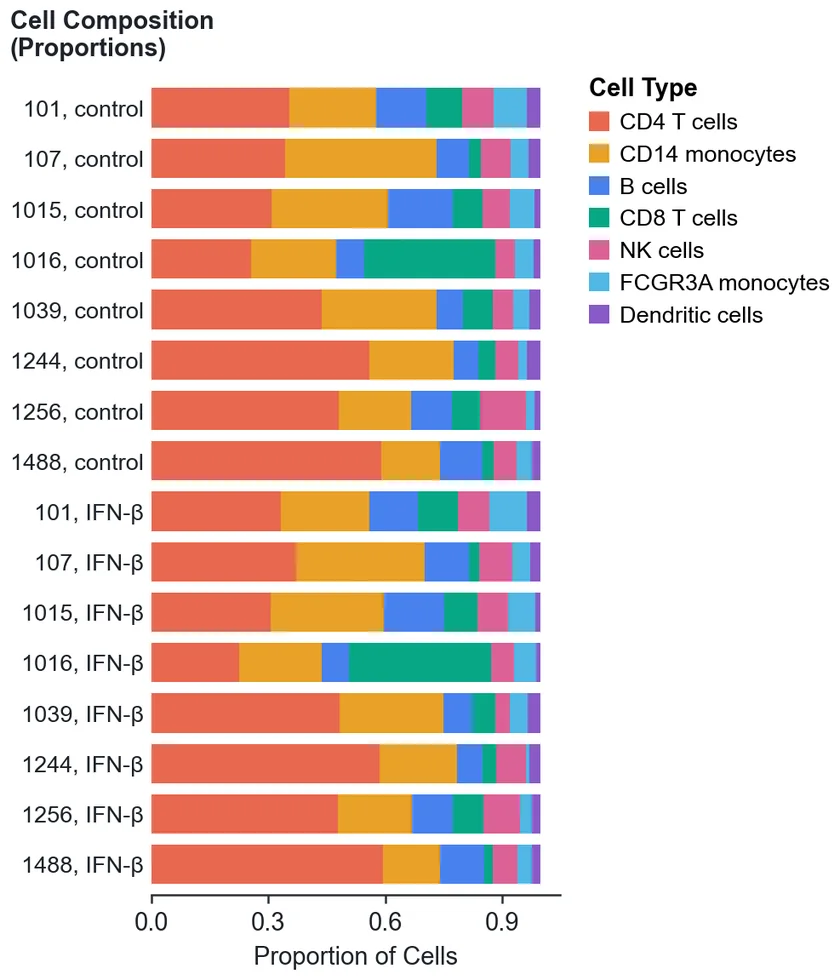
ECell type proportions in each sample, control and IFN-β
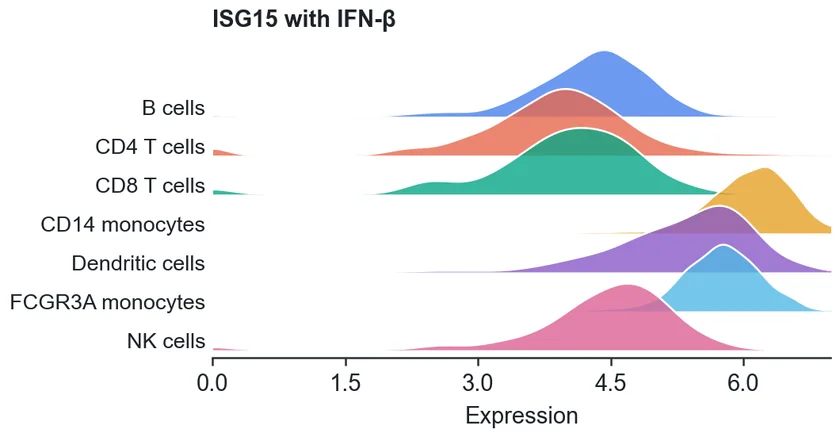
FRidge plot of ISG15 expression by cell type with IFN-β
  • Ask about your resultsThe chat knows your analysis.
  • Reports and codeFor every step.
  • Public data from GEOAnalyse it beside your own.
  • Every step explainedIn plain words, where it appears.

One platform for your lab’s sequencing data.

A 30-minute walkthrough with our team.