
CUT&Tag
A CUT&Tag analysis takes the fragments of CUT&Tag or CUT&RUN libraries, calls peaks, checks each library, and finds where the mark sits and where it changes between conditions.
Start a CUT&Tag analysis
In a project, click New session and choose CUT&Tag as the kind of analysis. CUT&RUN data goes the same way: both cut where the antibody sits and are read as fragments. The sidebar marks CUT&Tag with a peak.
What to upload
One file of fragments per sample:
- BAM files, paired-end, as bowtie2 or nf-core/cutandrun leave them. Each proper pair with a mapping quality of 10 or more is one fragment. Single-end reads are taken as they align.
- Fragment BED files (chromosome, start, end), including 10x and ArchR
fragments.tsv.gz, or BEDPE frombedtools bamtobed -bedpe.
Optional beside them:
- IgG controls: a sample with
IgGin its name is a control. It is not compared, it removes hot spots from the peaks, and it shows what background looks like in Library QC. - Peak files from SEACR or MACS2 (
.narrowPeak,.broadPeak,*.stringent.bed), named like their sample: they are used instead of calling that sample's peaks. - A GTF or GFF of the genes, for a genome UCSC does not have.
- Spike-in fragments: reads on the E. coli (or Drosophila) genome in the same BAM are counted
on their own. When the spike-in genome was aligned separately, upload its files named like the sample with
spike-inorecoliin the name.
Coverage tracks (bedGraph, bigWig) cannot be read: they have lost the fragments.
From FASTQ files
FASTQ files go to Reads, on the Data page. Its pre-flight tells CUT&Tag's DNA from RNA, the reads are aligned to the genome with Bowtie 2 and the E. coli spike-in counted, and Start a CUT&Tag analysis opens the BAM files here, the spike-in with them. Name IgG controls with IgG in the sample sheet.
Import from GEO
On a new CUT&Tag session's start screen, Import from GEO takes a series or sample number (GSE or GSM). It lists each sample's fragment files, BAM files and peak files, and leaves out the coverage tracks; you pick the samples, and their cell line, treatment or other varying characteristic fills the condition in the metadata step. A GEO sample with two replicates' files (as in Kaya-Okur et al.'s GSE124557) becomes two samples of the same condition. Name nothing: IgG samples are found by their name, as with an upload.
What the upload does
Fragments on chrM, on a spike-in genome and on unplaced contigs are counted and set apart. The genome build comes from the BAM header, or from how far the fragments reach; between two builds of one species (hg19 and hg38) the one whose genes the fragments gather at wins. With the build known, the genes (RefSeq Select) are fetched from UCSC and the ENCODE blacklist is removed. Duplicates stay in the samples, because Tn5 inserts at the same sites again and again, and leave the IgG controls, as nf-core/cutandrun does.
How peaks are called
A candidate is a block of contiguous signal, as SEACR defines it, never a block of one fragment. A block is a peak when it holds more fragments than the background puts there, as MACS tests it: the genome-wide rate over the block, or with IgG controls the IgG's rate in the 10 kb around it, scaled to the sample's depth, whichever is higher (Poisson, Benjamini-Hochberg, q below 0.01). A peak where the IgG holds half the signal or more is a hot spot and is dropped. The regions called in at least two samples are the consensus, and the fragments over each are the counts the comparisons use.
SEACR's own rule, the strongest 1% of blocks, is in Peak Calling too. It keeps the same number of peaks whatever the mark: on Kaya-Okur et al.'s K562 H3K4me3, with 3.7 million fragments, it found 3,000 peaks and a quarter of the 10,400 promoters with ten times the background signal; the test finds 12,000 and 82% of them.
Normalization
The signal steps offer three: CPM (per million fragments), Reads in peaks (per million fragments in the consensus) and Spike-in (CPM scaled by each sample's spike-in share, offered when every sample has one). Differential Binding offers Library size (DiffBind 3's default, which shows a mark that rises everywhere as a rise), DESeq2 (reads in peaks), which assumes most peaks do not change, and Spike-in, the only one that sees a global change per cell.
Library QC
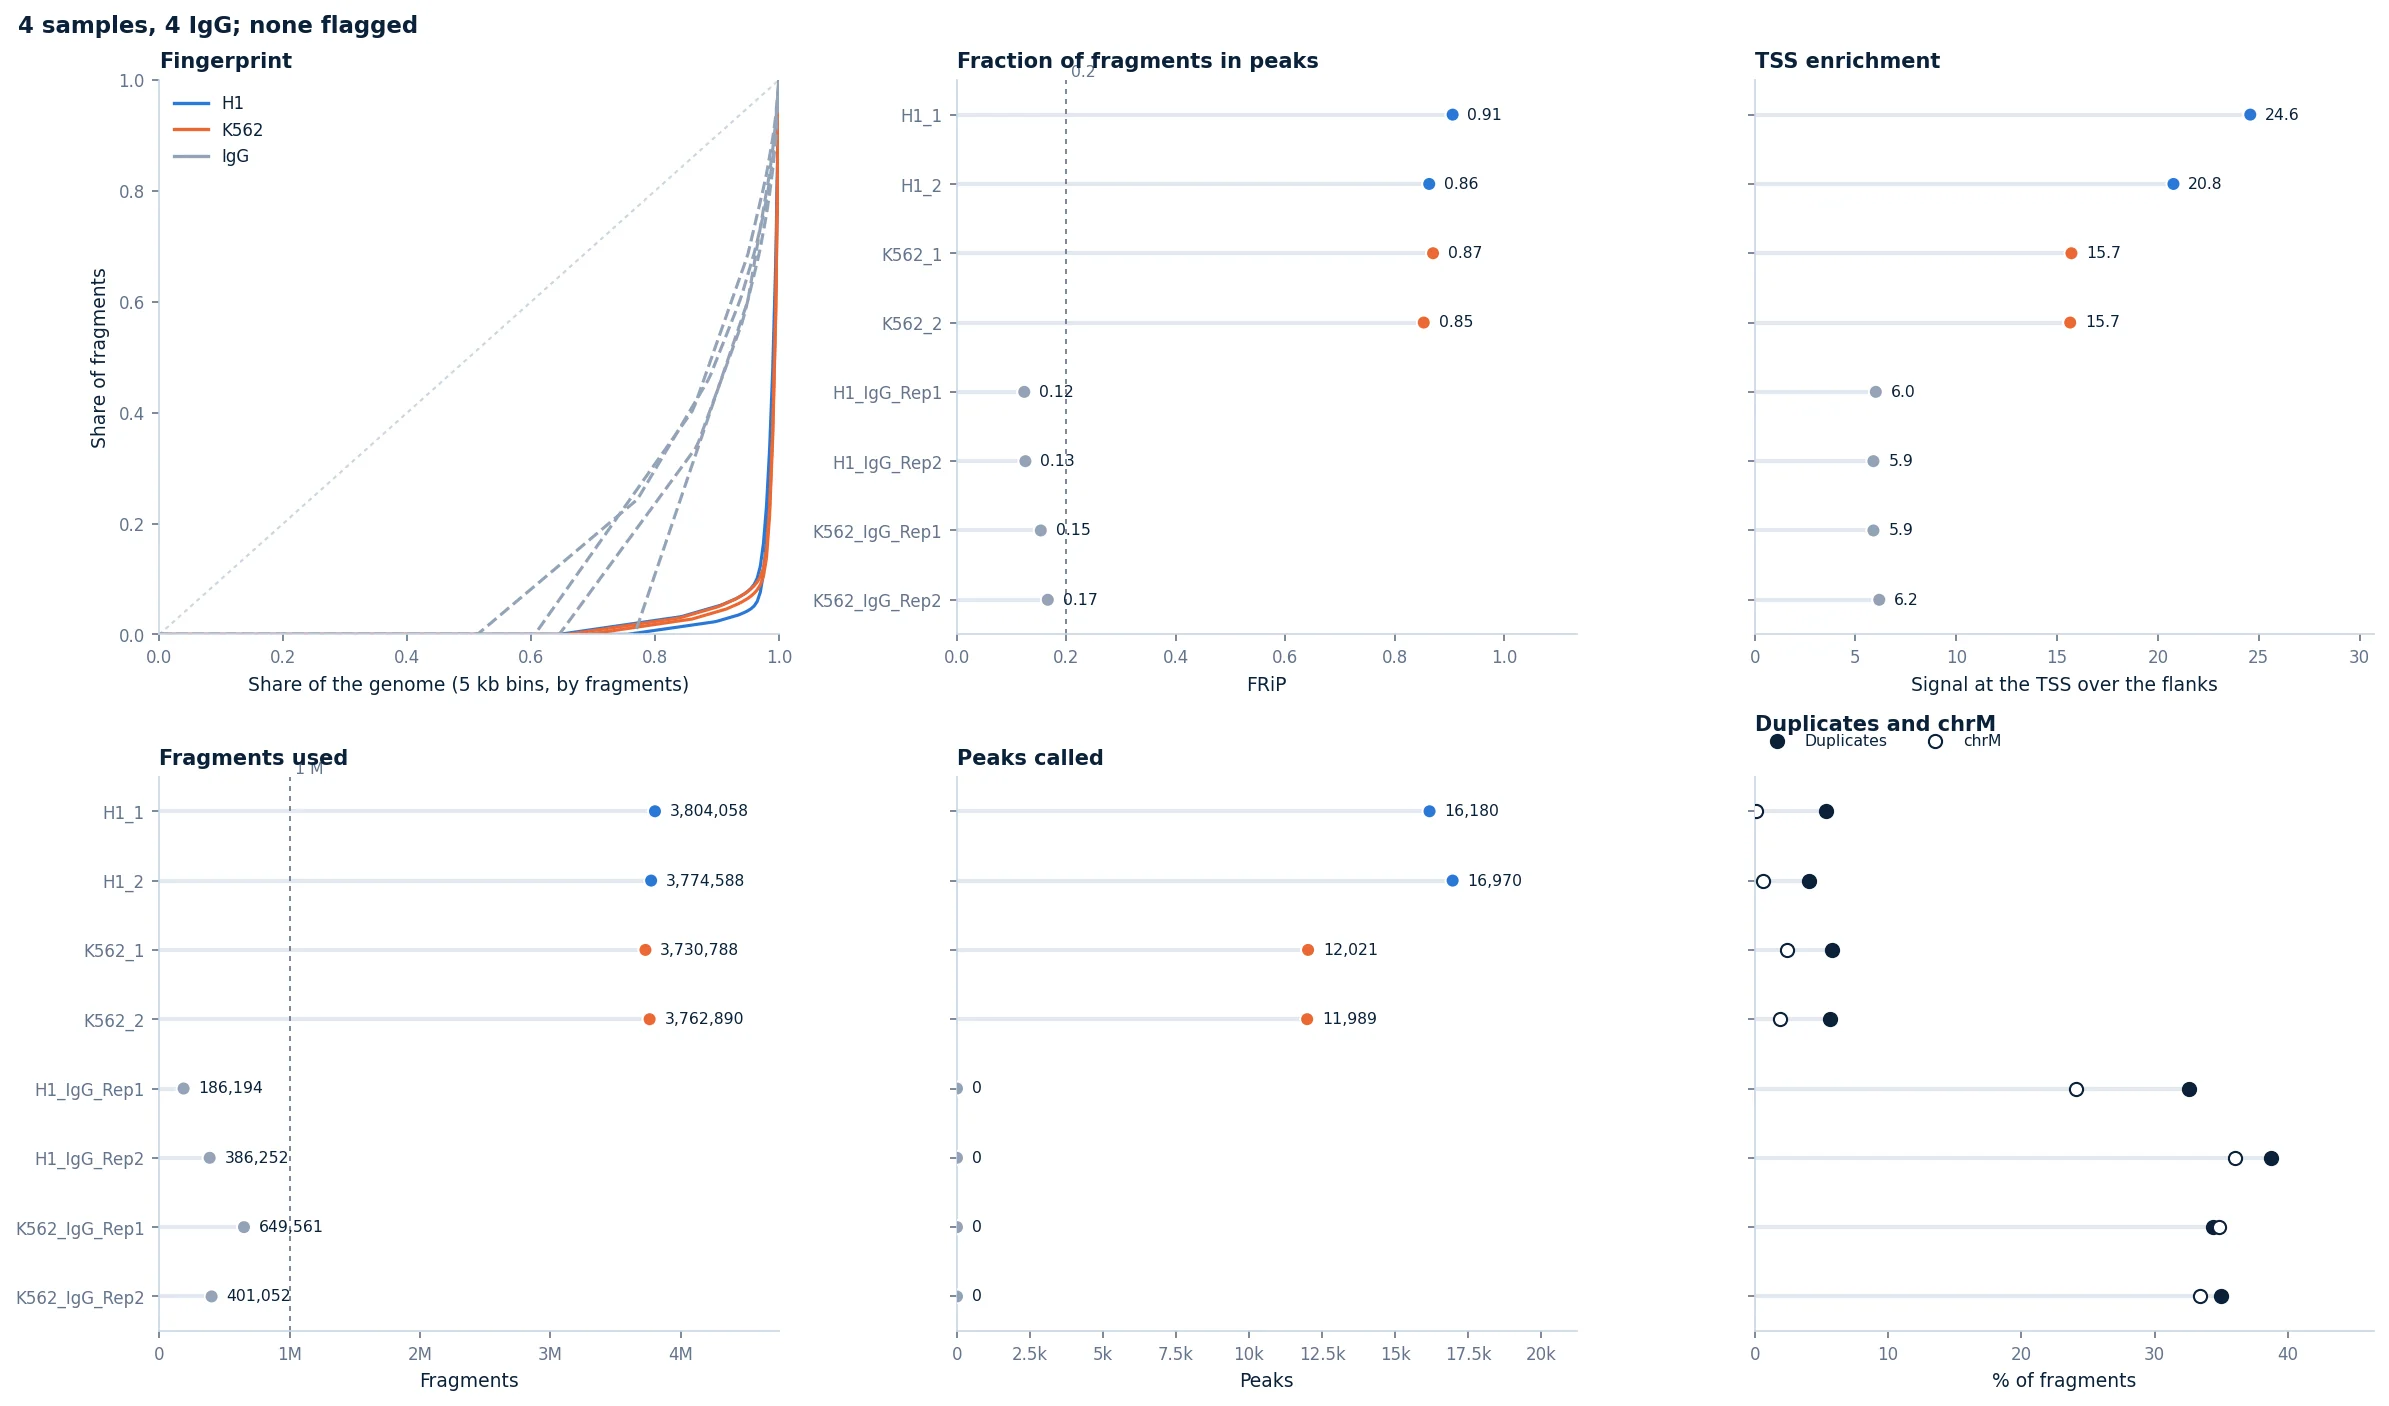
Every library and IgG control in one order: the fingerprint (an enriched library stays low and rises at the end, an IgG follows the diagonal more closely), FRiP, TSS enrichment, fragments, peaks, duplicates and chrM. Active marks gather at TSSs; repressive ones need not, so TSS enrichment is shown but not flagged.
Where the mark sits
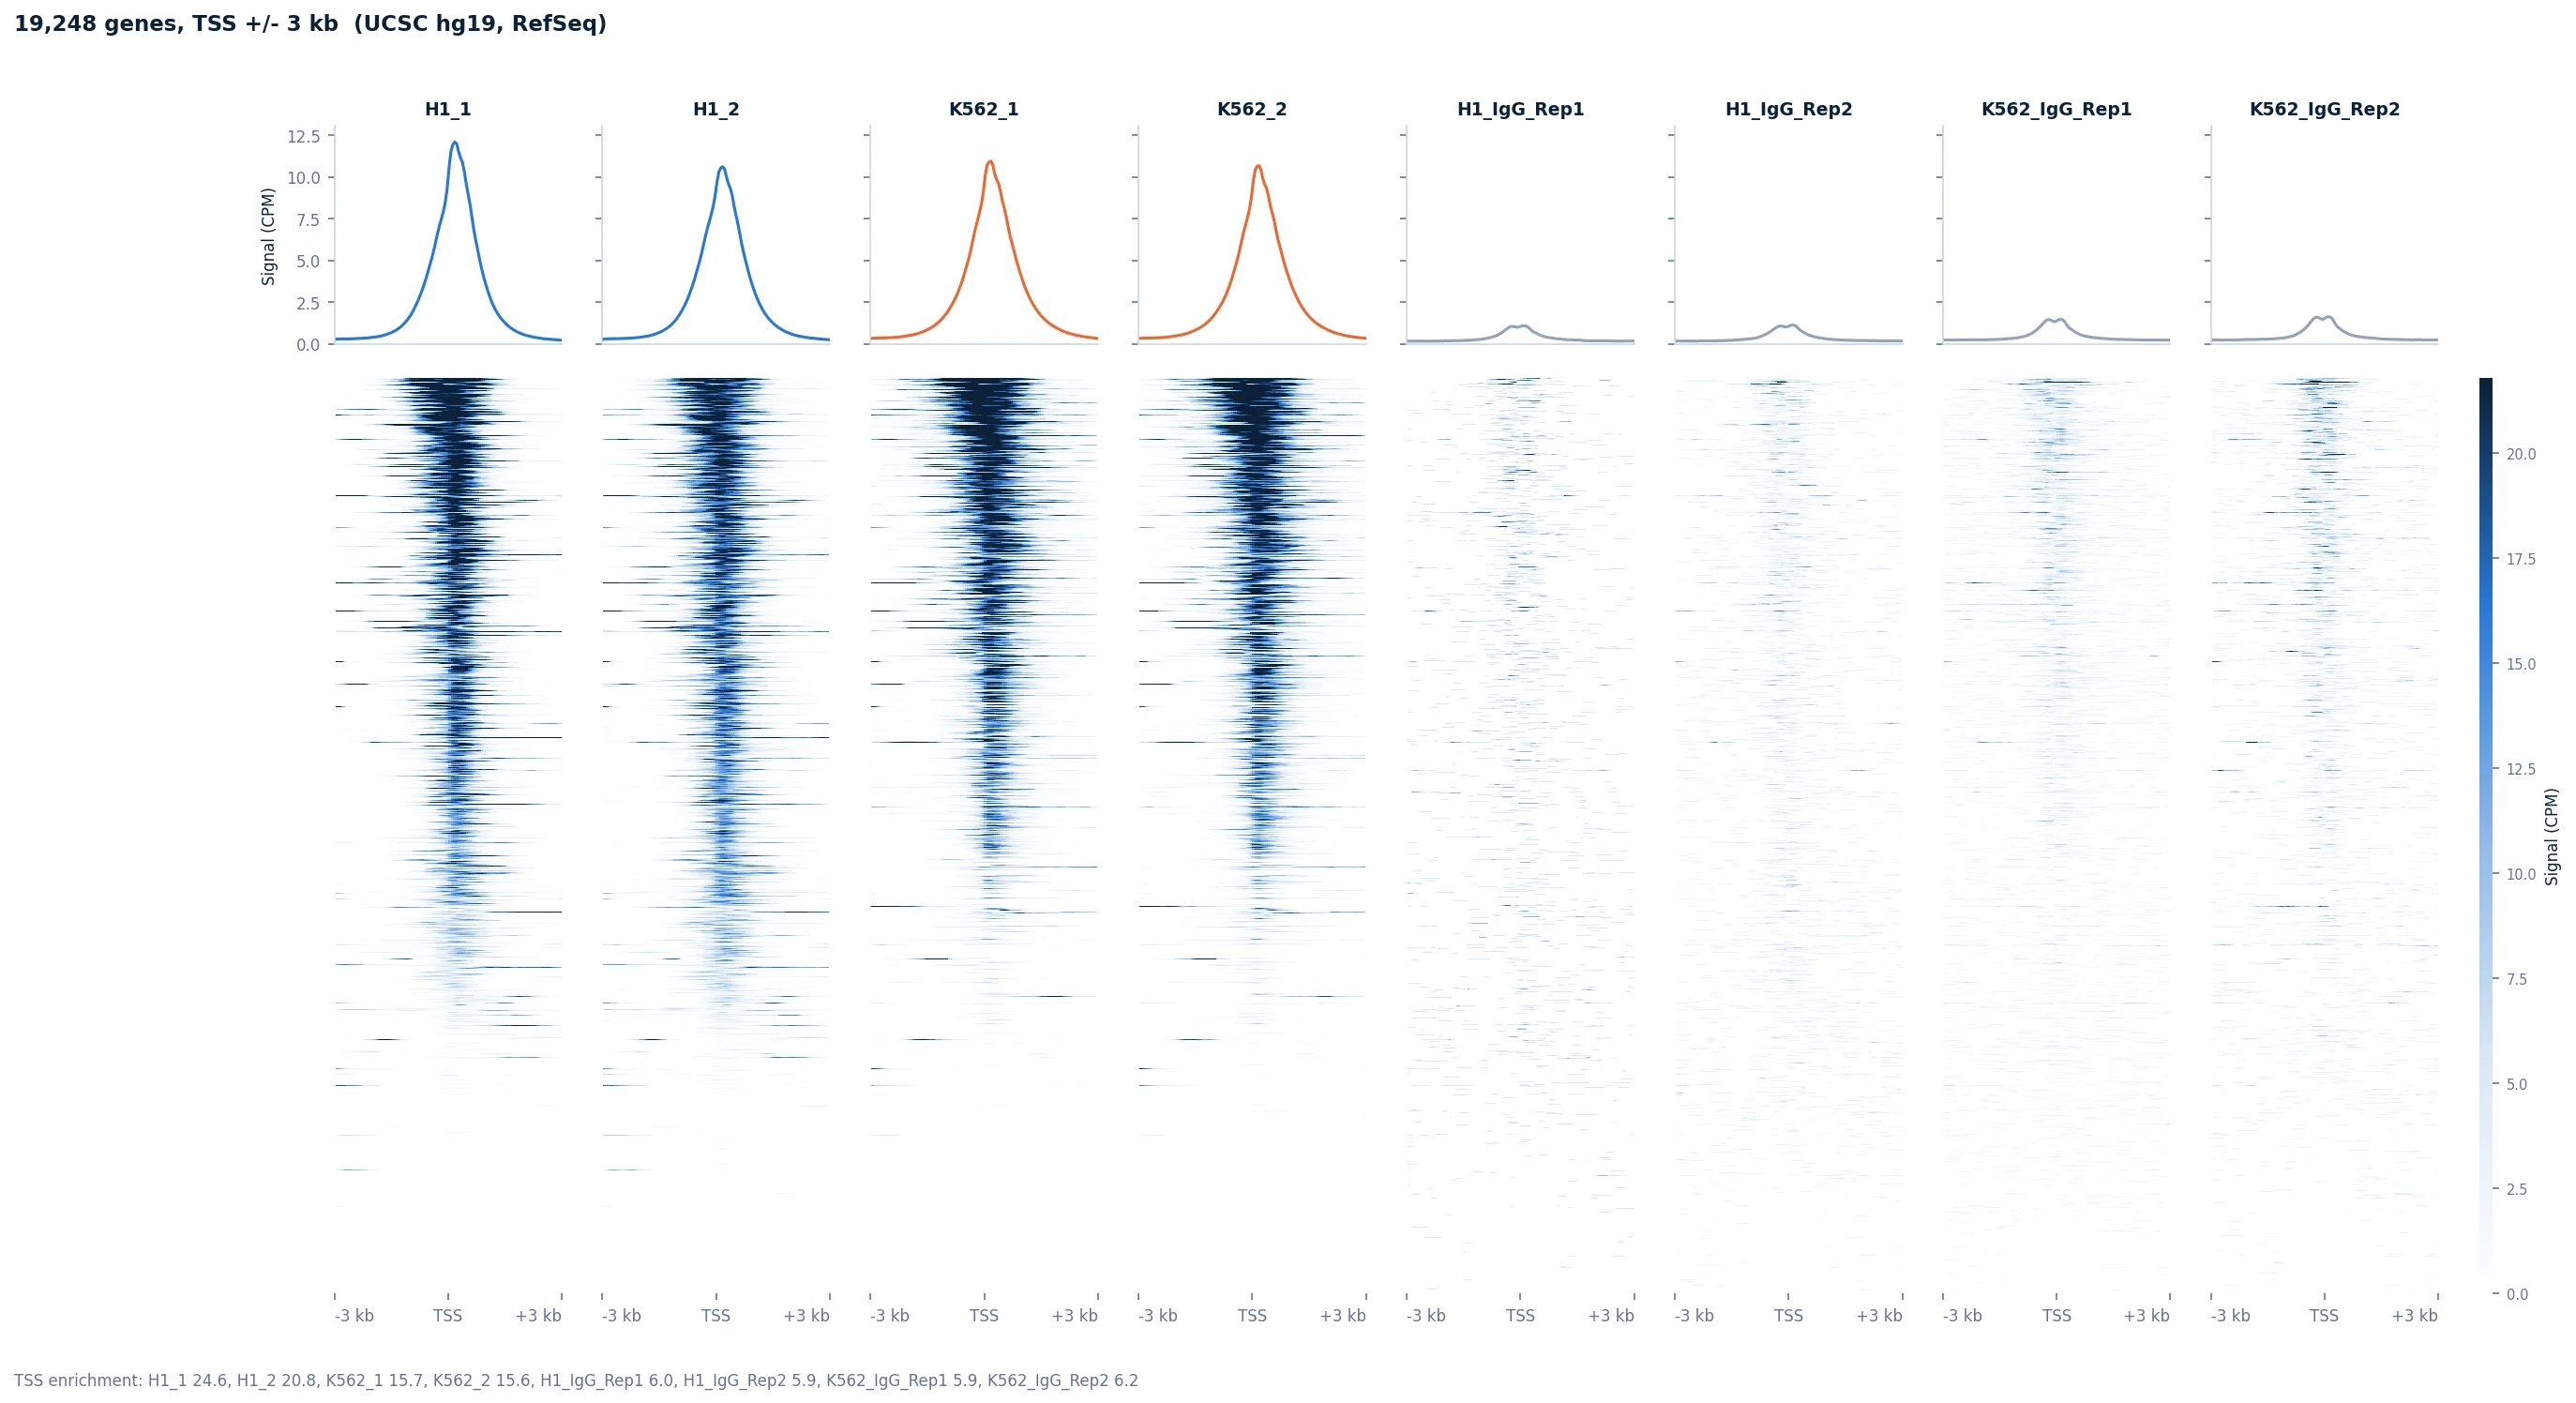
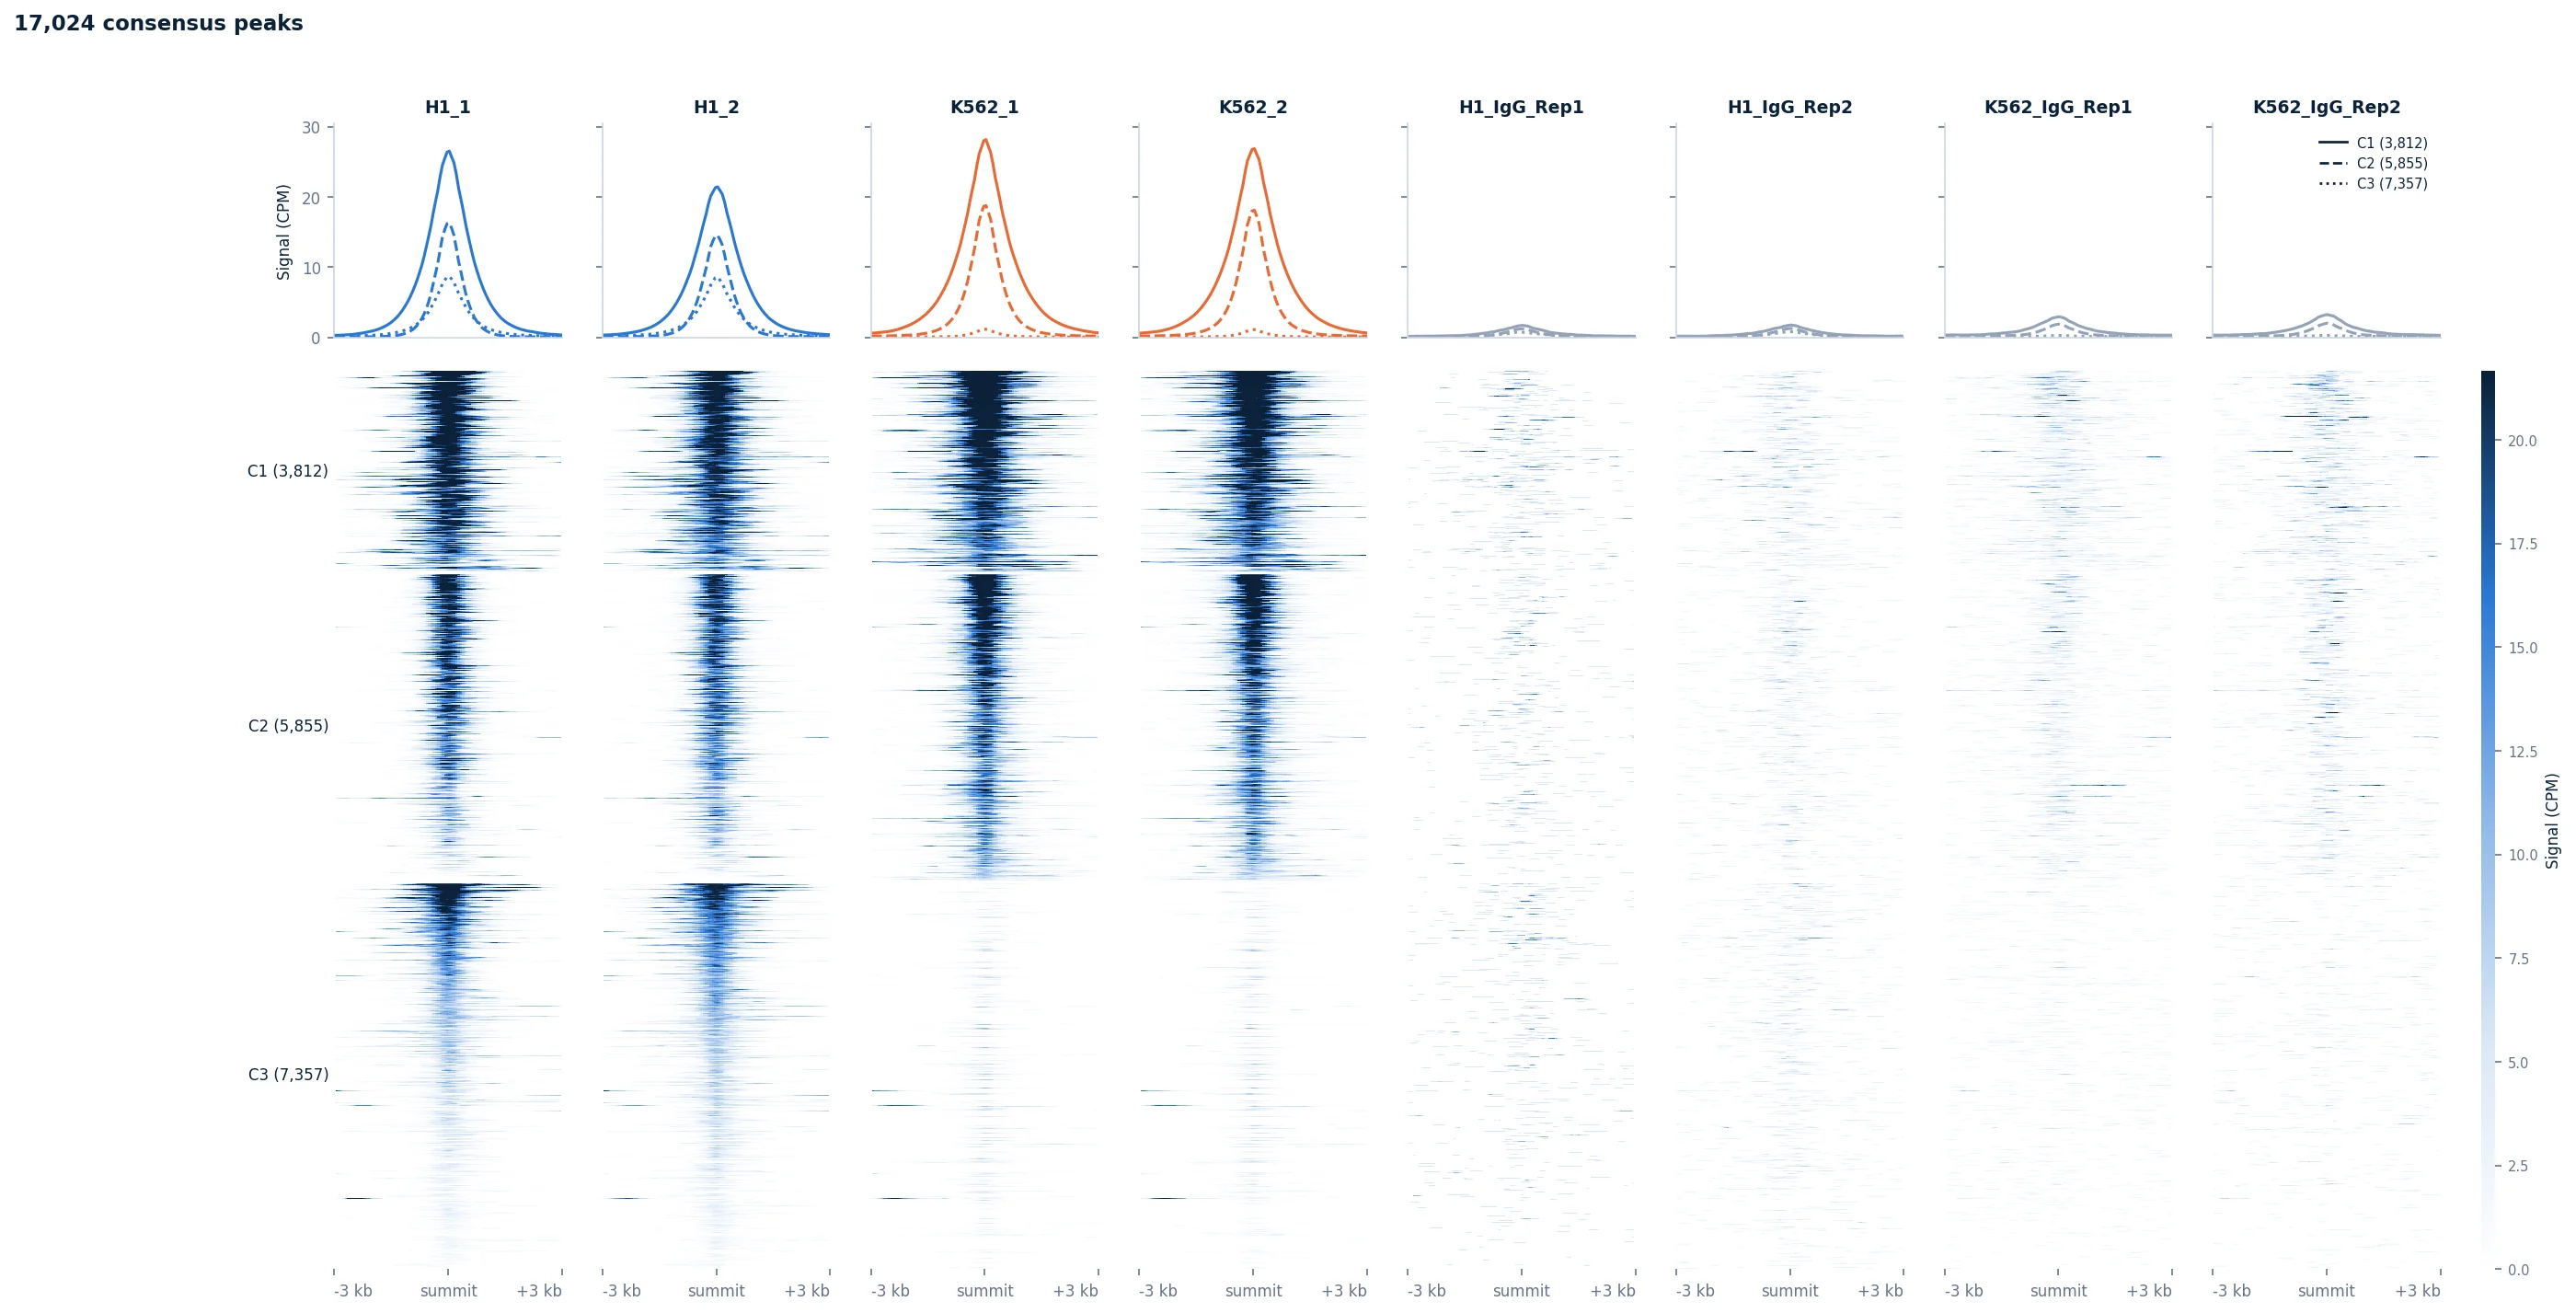
Signal at Genes draws every gene's TSS (or its body, scaled TSS to TES) as deepTools does, the genes sorted by signal; Signal at Peaks centres every peak on its summit and clusters the peaks by their pattern across samples.
What changes
Sample datasets
Browse Sample Datasets in a CUT&Tag session lists two from Kaya-Okur et al. (2019): H3K4me3 and H3K27me3 in K562 against H1, two replicates each, with each cell line's IgG controls.
Sample metadata
As in bulk RNA-seq, the metadata editor asks for a condition per sample. IgG controls are not samples: they do not appear in it.
Step reference
| Step | Stage | What it does | You get | Key inputs |
|---|---|---|---|---|
| Data Upload | Setup | Reads one file of fragments per sample, sets apart chrM, the spike-in genome and unplaced contigs, removes the ENCODE blacklist, finds the genome build, calls every sample's peaks and counts the fragments over the consensus. | Fragments per sample and what was set apart, and the fragment lengths with the nucleosome ladder. | BAM, fragment BED or BEDPE files (see What to upload). |
| Library QC | QC | Checks every library and IgG control: the fingerprint, the fraction of fragments in peaks (FRiP), TSS enrichment, fragments, peaks, duplicates and chrM. Flags fewer than a million fragments, FRiP under 0.2, over half duplicates, and a fingerprint no steeper than the IgG's. | Six panels with the samples in one order, the flagged ones in red, and a table per sample. | Group by. |
| Peak Calling | QC | Calls the peaks again from the stored fragments: a stricter or looser threshold (or SEACR's own, the strongest share of blocks), how many samples must call a region, and whether the IgG is the background. The counts are made again over the new consensus. | Each sample's blocks ranked by signal with the weakest it calls a peak, peaks per sample, widths, and how many samples call each region; the consensus peaks as a table. | Threshold, Consensus, IgG controls. |
| Sample Similarity | QC | Correlates the samples over the most variable consensus peaks (log2, normalized), clusters them and runs a PCA. | A clustered correlation heatmap with each sample's group, and the first two principal components. | Group by, Normalization, Peaks used. |
| Signal at Genes | Analysis | Each sample's signal around every gene's TSS, or across gene bodies scaled from TSS to TES, as deepTools computeMatrix and plotHeatmap draw it, and TSS enrichment. | Heatmaps with mean profiles, one column per sample or group, genes sorted by signal; each gene's signal at its promoter as a table. | Region, Window, Show, Group by, Normalization, Genome build. |
| Signal at Peaks | Analysis | The signal around every consensus peak's summit, the peaks clustered by their pattern across samples (k-means), or the peaks Differential Binding called, gained above lost. | Heatmaps with a mean profile per cluster, and each peak's cluster and signal as a table. | Peaks, Clusters, Window, Show, Group by, Normalization. |
| Peak Overlap | Analysis | Compares the samples' own peaks: the base-pair Jaccard of every pair, and which combinations of samples call the same regions. | A Jaccard heatmap and an UpSet plot. | Group by. |
| Peak Annotation | Analysis | Annotates every peak with its nearest gene and where it lies (promoter, exon, intron, downstream, distal), as ChIPseeker does. | Where each sample's peaks lie, their distance to the nearest TSS upstream and downstream, their widths, and the annotated consensus as a table. | Group by, Genome build. |
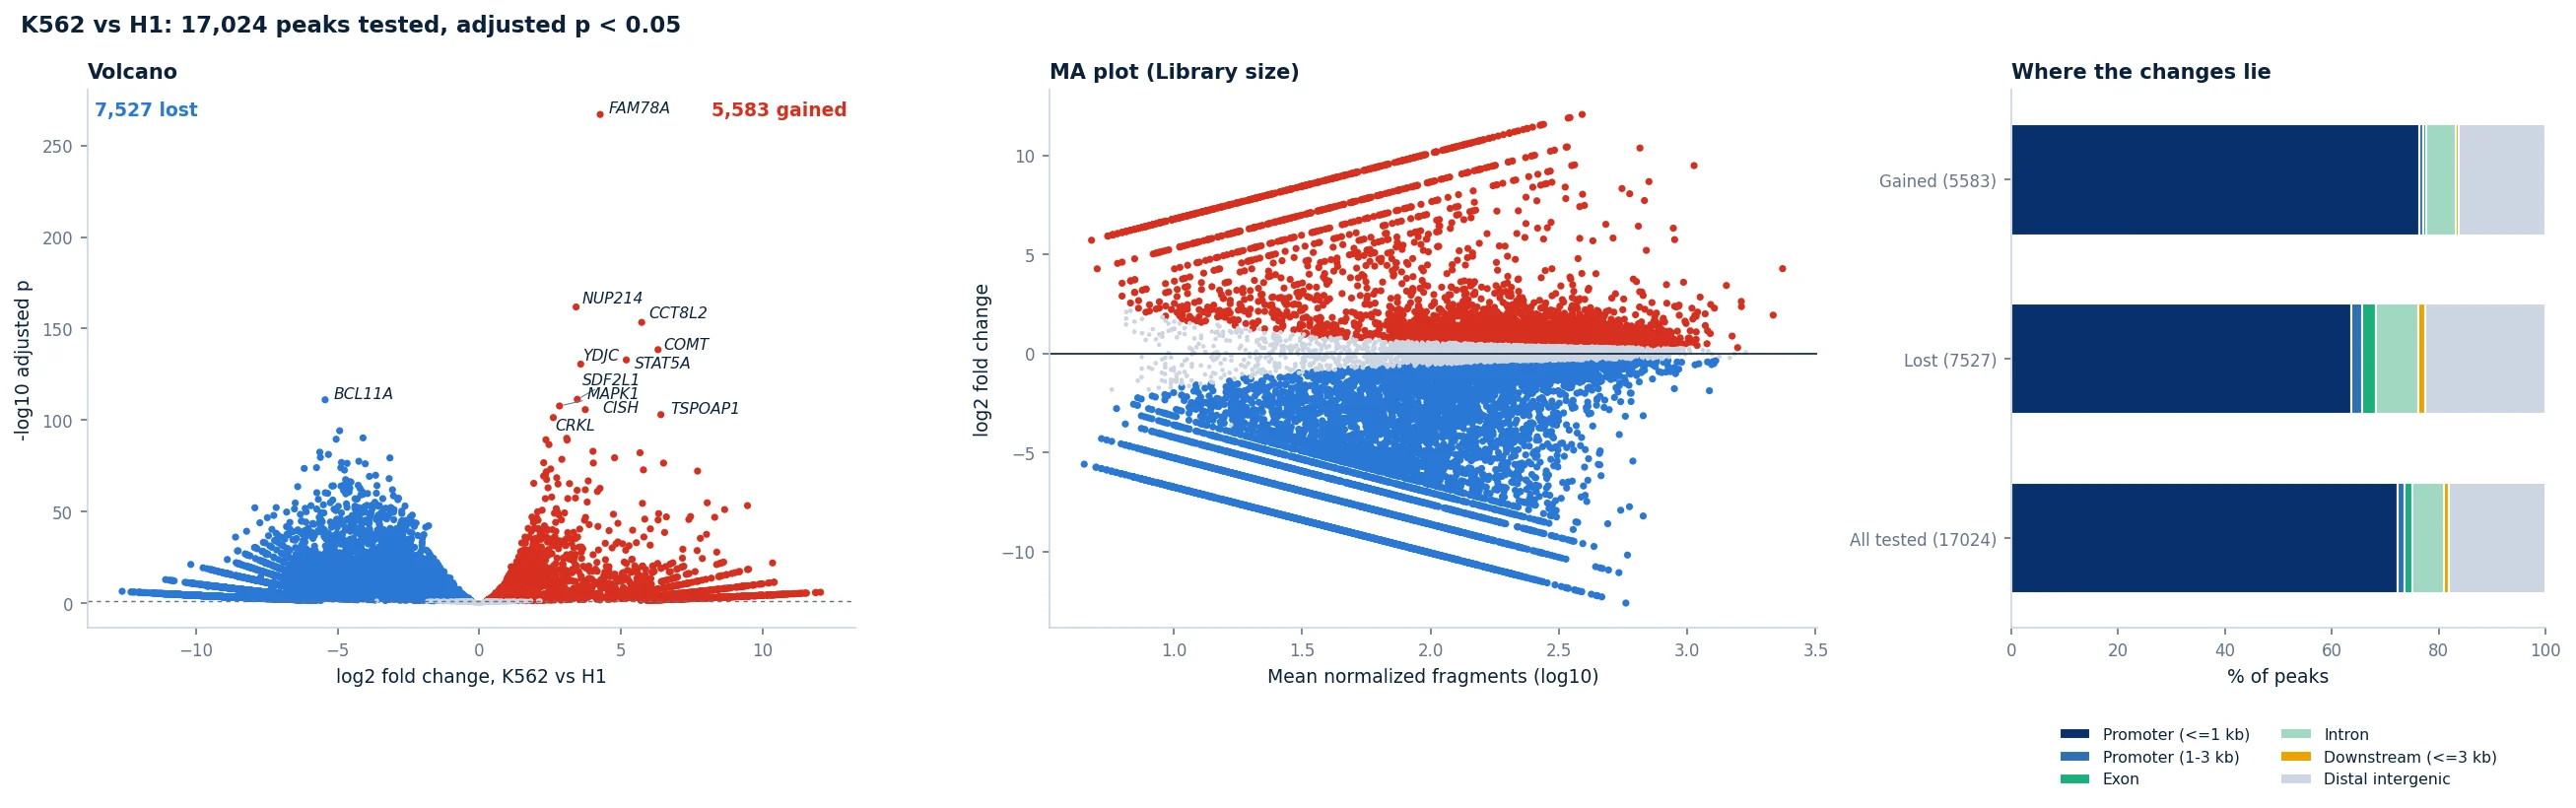
| Differential Binding | Analysis | Tests every consensus peak for more or less signal between two groups with DESeq2, as DiffBind does, normalized by library size, by reads in peaks or by the spike-in. | A volcano, an MA plot and where the gained and lost peaks lie, and a table of every peak tested. | Parameter to compare, two values, Normalization, Minimum fold change. |
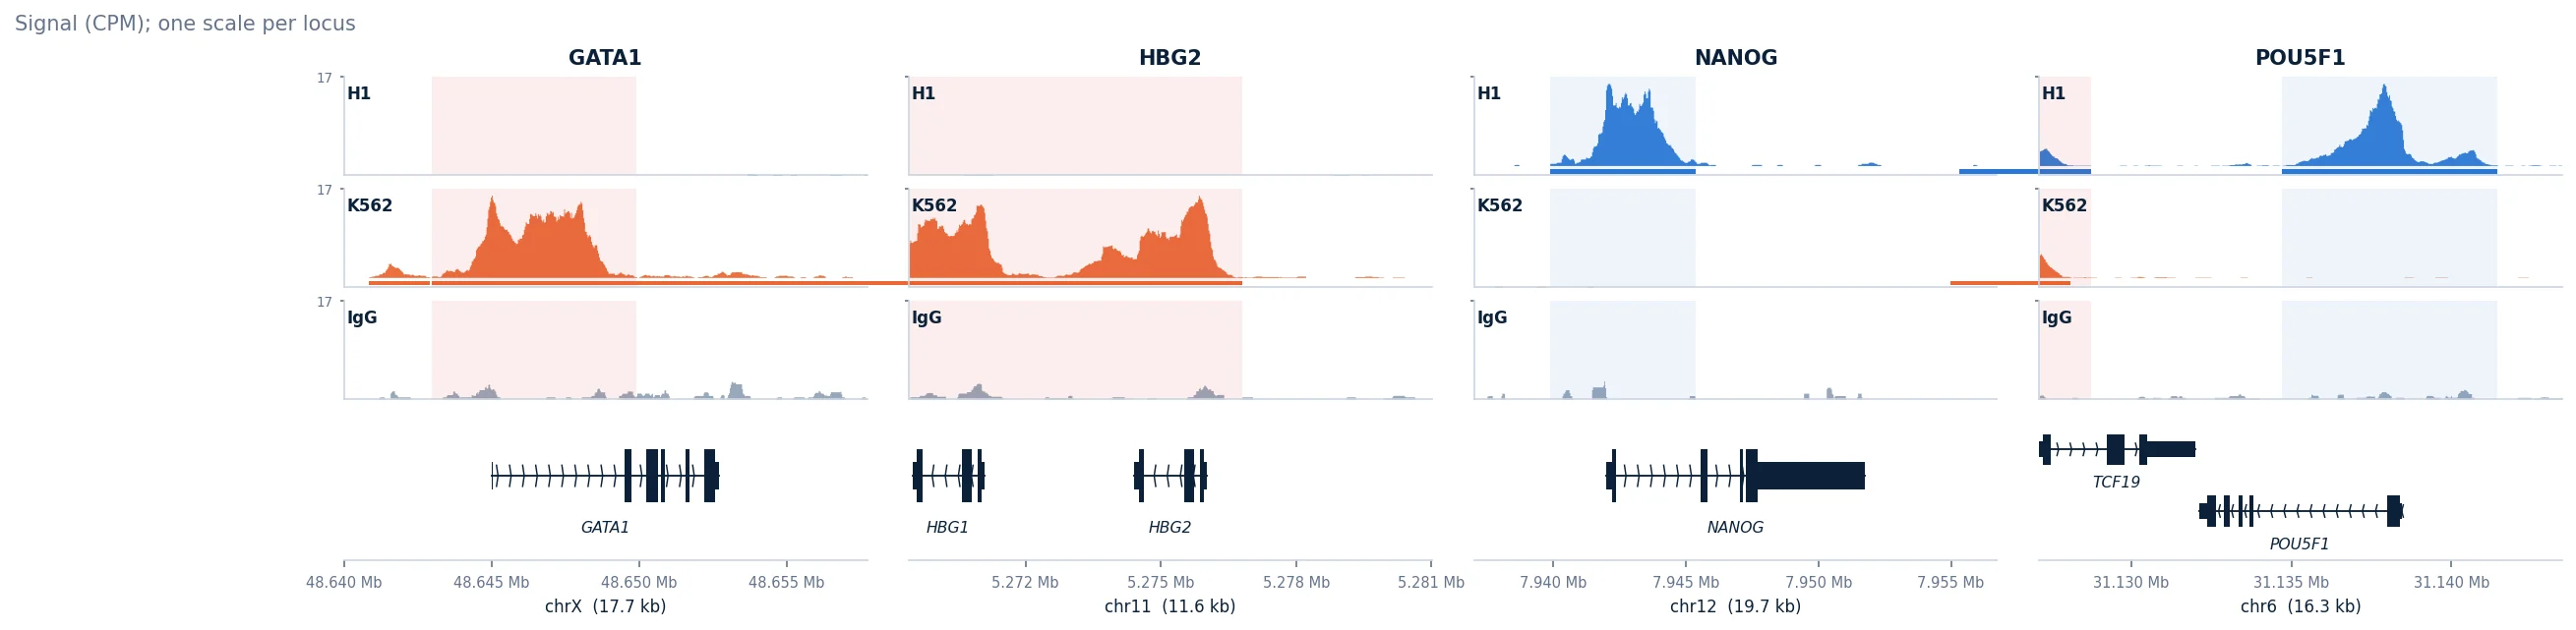
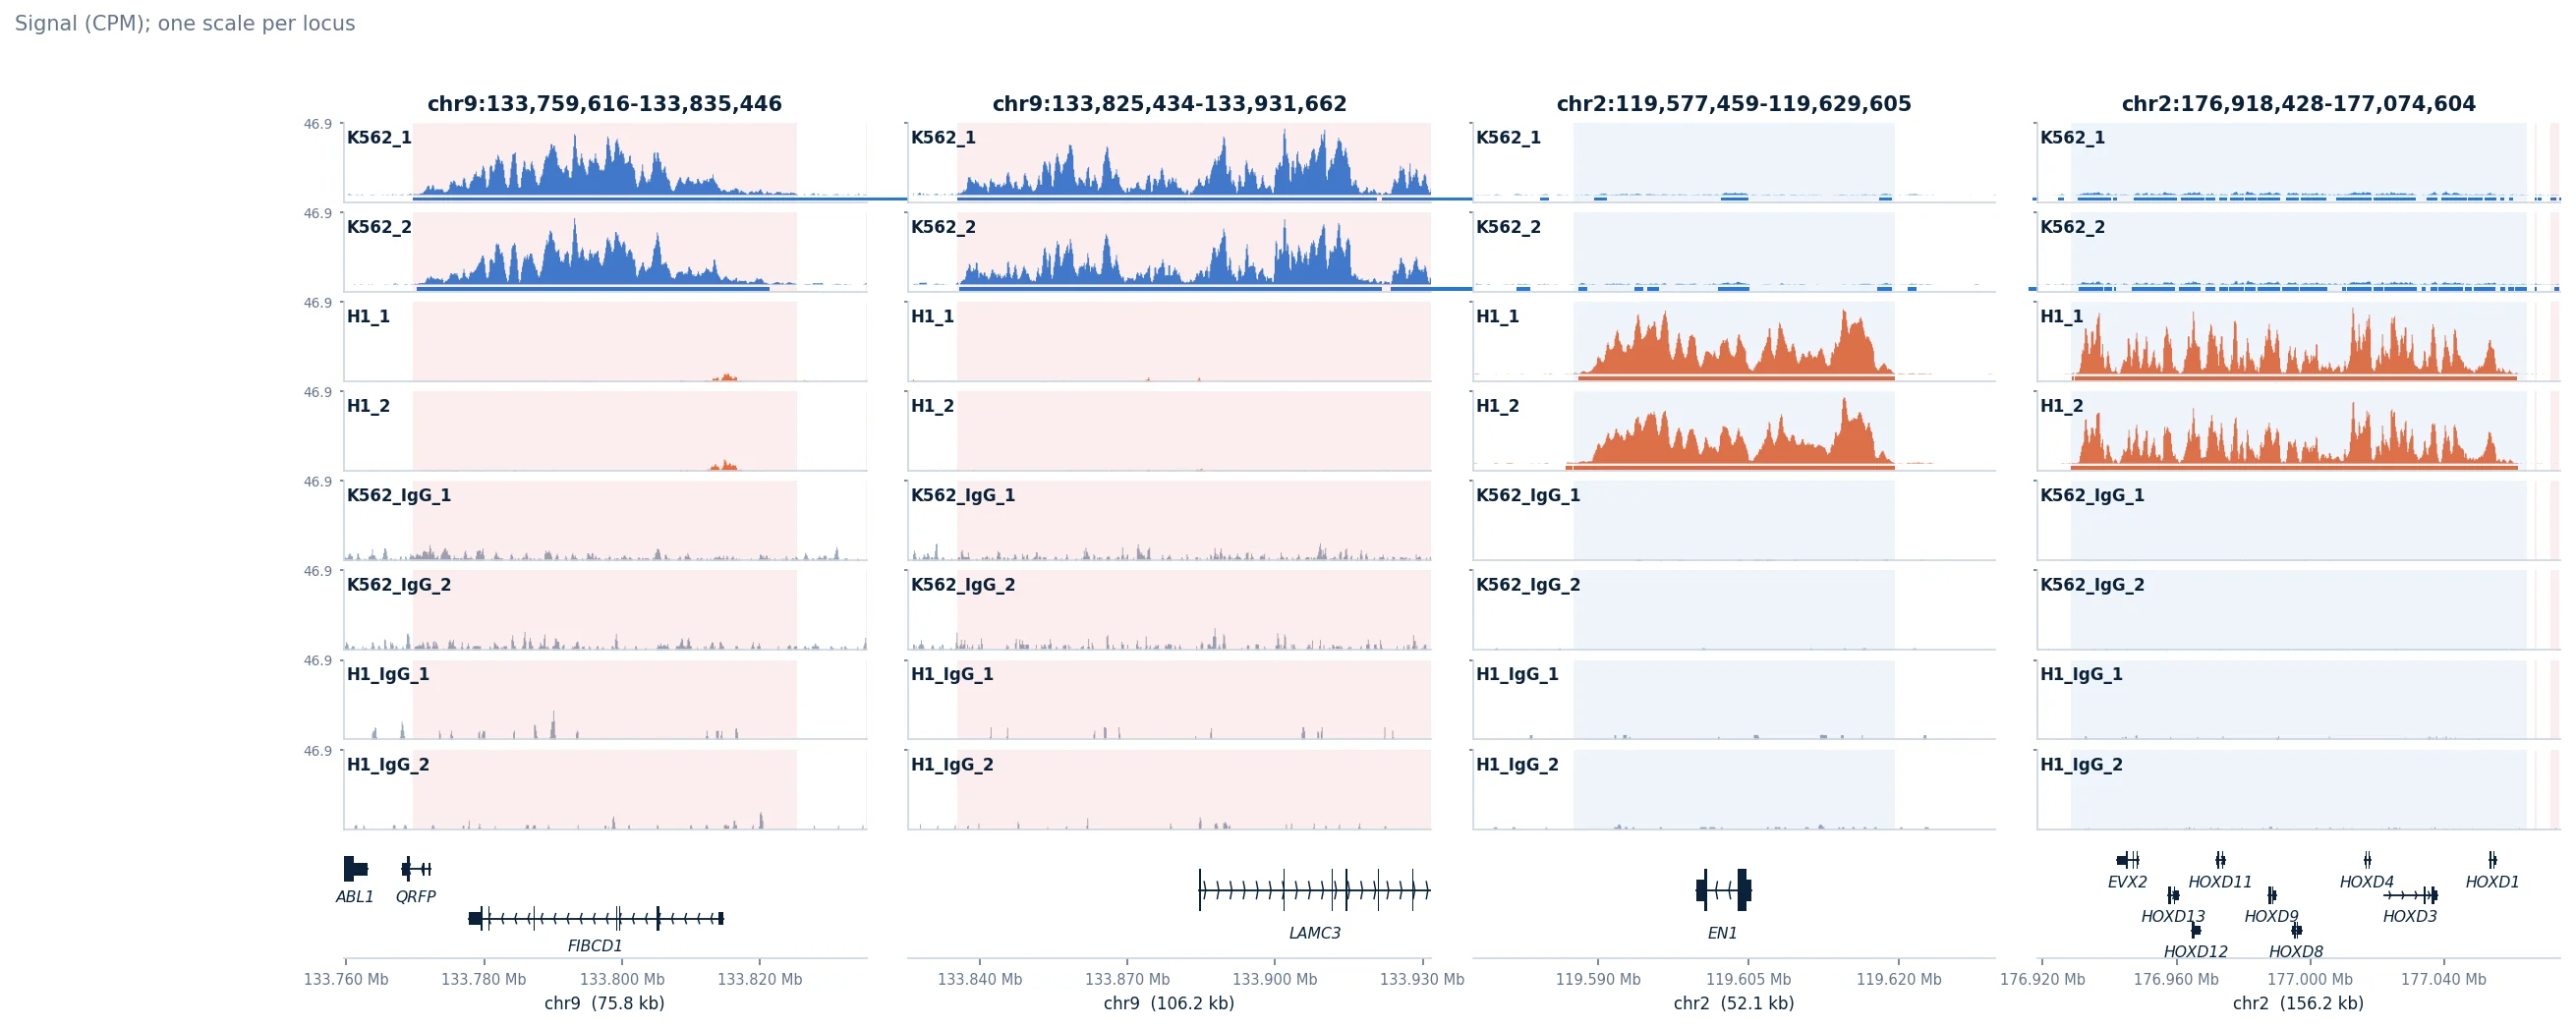
| Genome Tracks | Analysis | Shows the signal at the genes or regions you name (ask in the step's text box), or the strongest changes, as genome browser tracks. | One track per sample or group on one scale per locus, each sample's peaks, the genes, and the differential peaks shaded. | Show, Group by, Normalization, Genome build; genes or regions in your own words. |
On Kaya-Okur et al.'s H3K4me3 and H3K27me3 CUT&Tag of K562 and H1 cells (GEO GSE124557), the upload finds the build (hg19) from the fragments alone. H3K4me3 is lost in K562 at the pluripotency genes (NANOG, POU5F1, LIN28A, ZFP42, L1TD1) and gained at the erythroid ones (GATA1, TAL1, NFE2, KLF1, the fetal globins HBG1 and HBG2), with BCL11A, the fetal globin repressor, lost. H3K27me3 covers SOX17, GATA4, PAX6 and the HOX clusters in H1 and not in K562, and TAL1 in H1 only. Eight libraries (23 million fragments) upload in 15 seconds; every step runs in seconds. The steps are also tested on simulated libraries with a known answer, read from BAM, fragments.tsv.gz and BEDPE.