
CUT&RUN
A CUT&RUN analysis takes the fragments MNase cuts free where an antibody sits, calls peaks, checks each library, and finds where a factor or mark binds, how that changes between conditions, and a transcription factor's motif and footprint.
Start a CUT&RUN analysis
In a project, click New session and choose CUT&RUN as the kind of analysis. CUT&RUN (Skene and Henikoff 2017) cuts the DNA under an antibody with pA- or pAG-MNase and sequences the pieces it frees. Most of its analysis is CUT&Tag's, which reads fragments the same way; this page says what MNase changes.
What to upload
One file of fragments per sample: a paired-end BAM (as Bowtie 2 or nf-core/cutandrun leave it),
a fragment BED (chromosome, start, end; 10x fragments.tsv.gz too) or
BEDPE. A sample with IgG in its name is a control. Peak files from SEACR or MACS2 named
like their sample, and a GTF of the genes, are optional, as for CUT&Tag. Spike-in fragments are counted when they
are on their own genome in the BAM (an E. coli sequence, or a yeast or fly genome added with a prefix such as
sacCer3_) or in a file named like the sample with spike-in or ecoli.
FASTQ files go to FASTQ upload, which aligns them as nf-core/cutandrun does and opens
them here; Import from GEO on the start screen lists a series' fragment, BAM and peak files.
What MNase changes
- Fragment sizes. MNase trims the DNA down to what a protein protects: a bound transcription factor leaves fragments under about 120 bp, a nucleosome about 150 bp and more (Skene and Henikoff 2017). Peak Calling, Signal at Genes, Signal at Peaks, Genome Tracks and the footprints take a choice: All fragments, Up to 120 bp (a factor's own sites, as CUT&RUNTools analyses factors) or 150 bp and over (nucleosomes, a histone mark's). Library QC shows each sample's share of fragments up to 120 bp, and the upload's length plot names that band.
- Problem regions. Beside ENCODE's blacklist, the upload leaves out the CUT&RUN suspect list (Nordin et al. 2023): regions where CUT&RUN finds fragments in negative controls whatever the antibody, 1,049 in hg38, 559 in mm10 and 565 in mm39. The paper has no hg19 list, so hg19 keeps the blacklist only.
- Duplicates stay in the samples and leave the IgG controls, as nf-core/cutandrun does: MNase cuts at the edges of a bound factor, so fragments with the same ends are often different molecules.
- Quality. Library QC flags fewer than 3 million fragments (EpiCypher asks for 3 to 8 million reads; Meers et al. 2019 sequenced 3 to 5 million), over 20% duplicates, and a FRiP under twice the IgG's. No study gives CUT&RUN a FRiP floor, and a transcription factor's few sharp peaks hold little of a library (VDR with calcitriol: 10,000 peaks and 4% of the fragments), so the floor is ENCODE's for transcription factor ChIP-seq, 1%; the comparison with the IgG carries the weight.
- Spike-in. pA- and pAG-MNase carry E. coli DNA into every reaction, and kits add more; yeast or fly DNA can be added instead. Spike-in normalization divides each sample by its spike-in fragments, as the Henikoff lab's 10,000 over the spike-in reads does.
Motifs and footprints
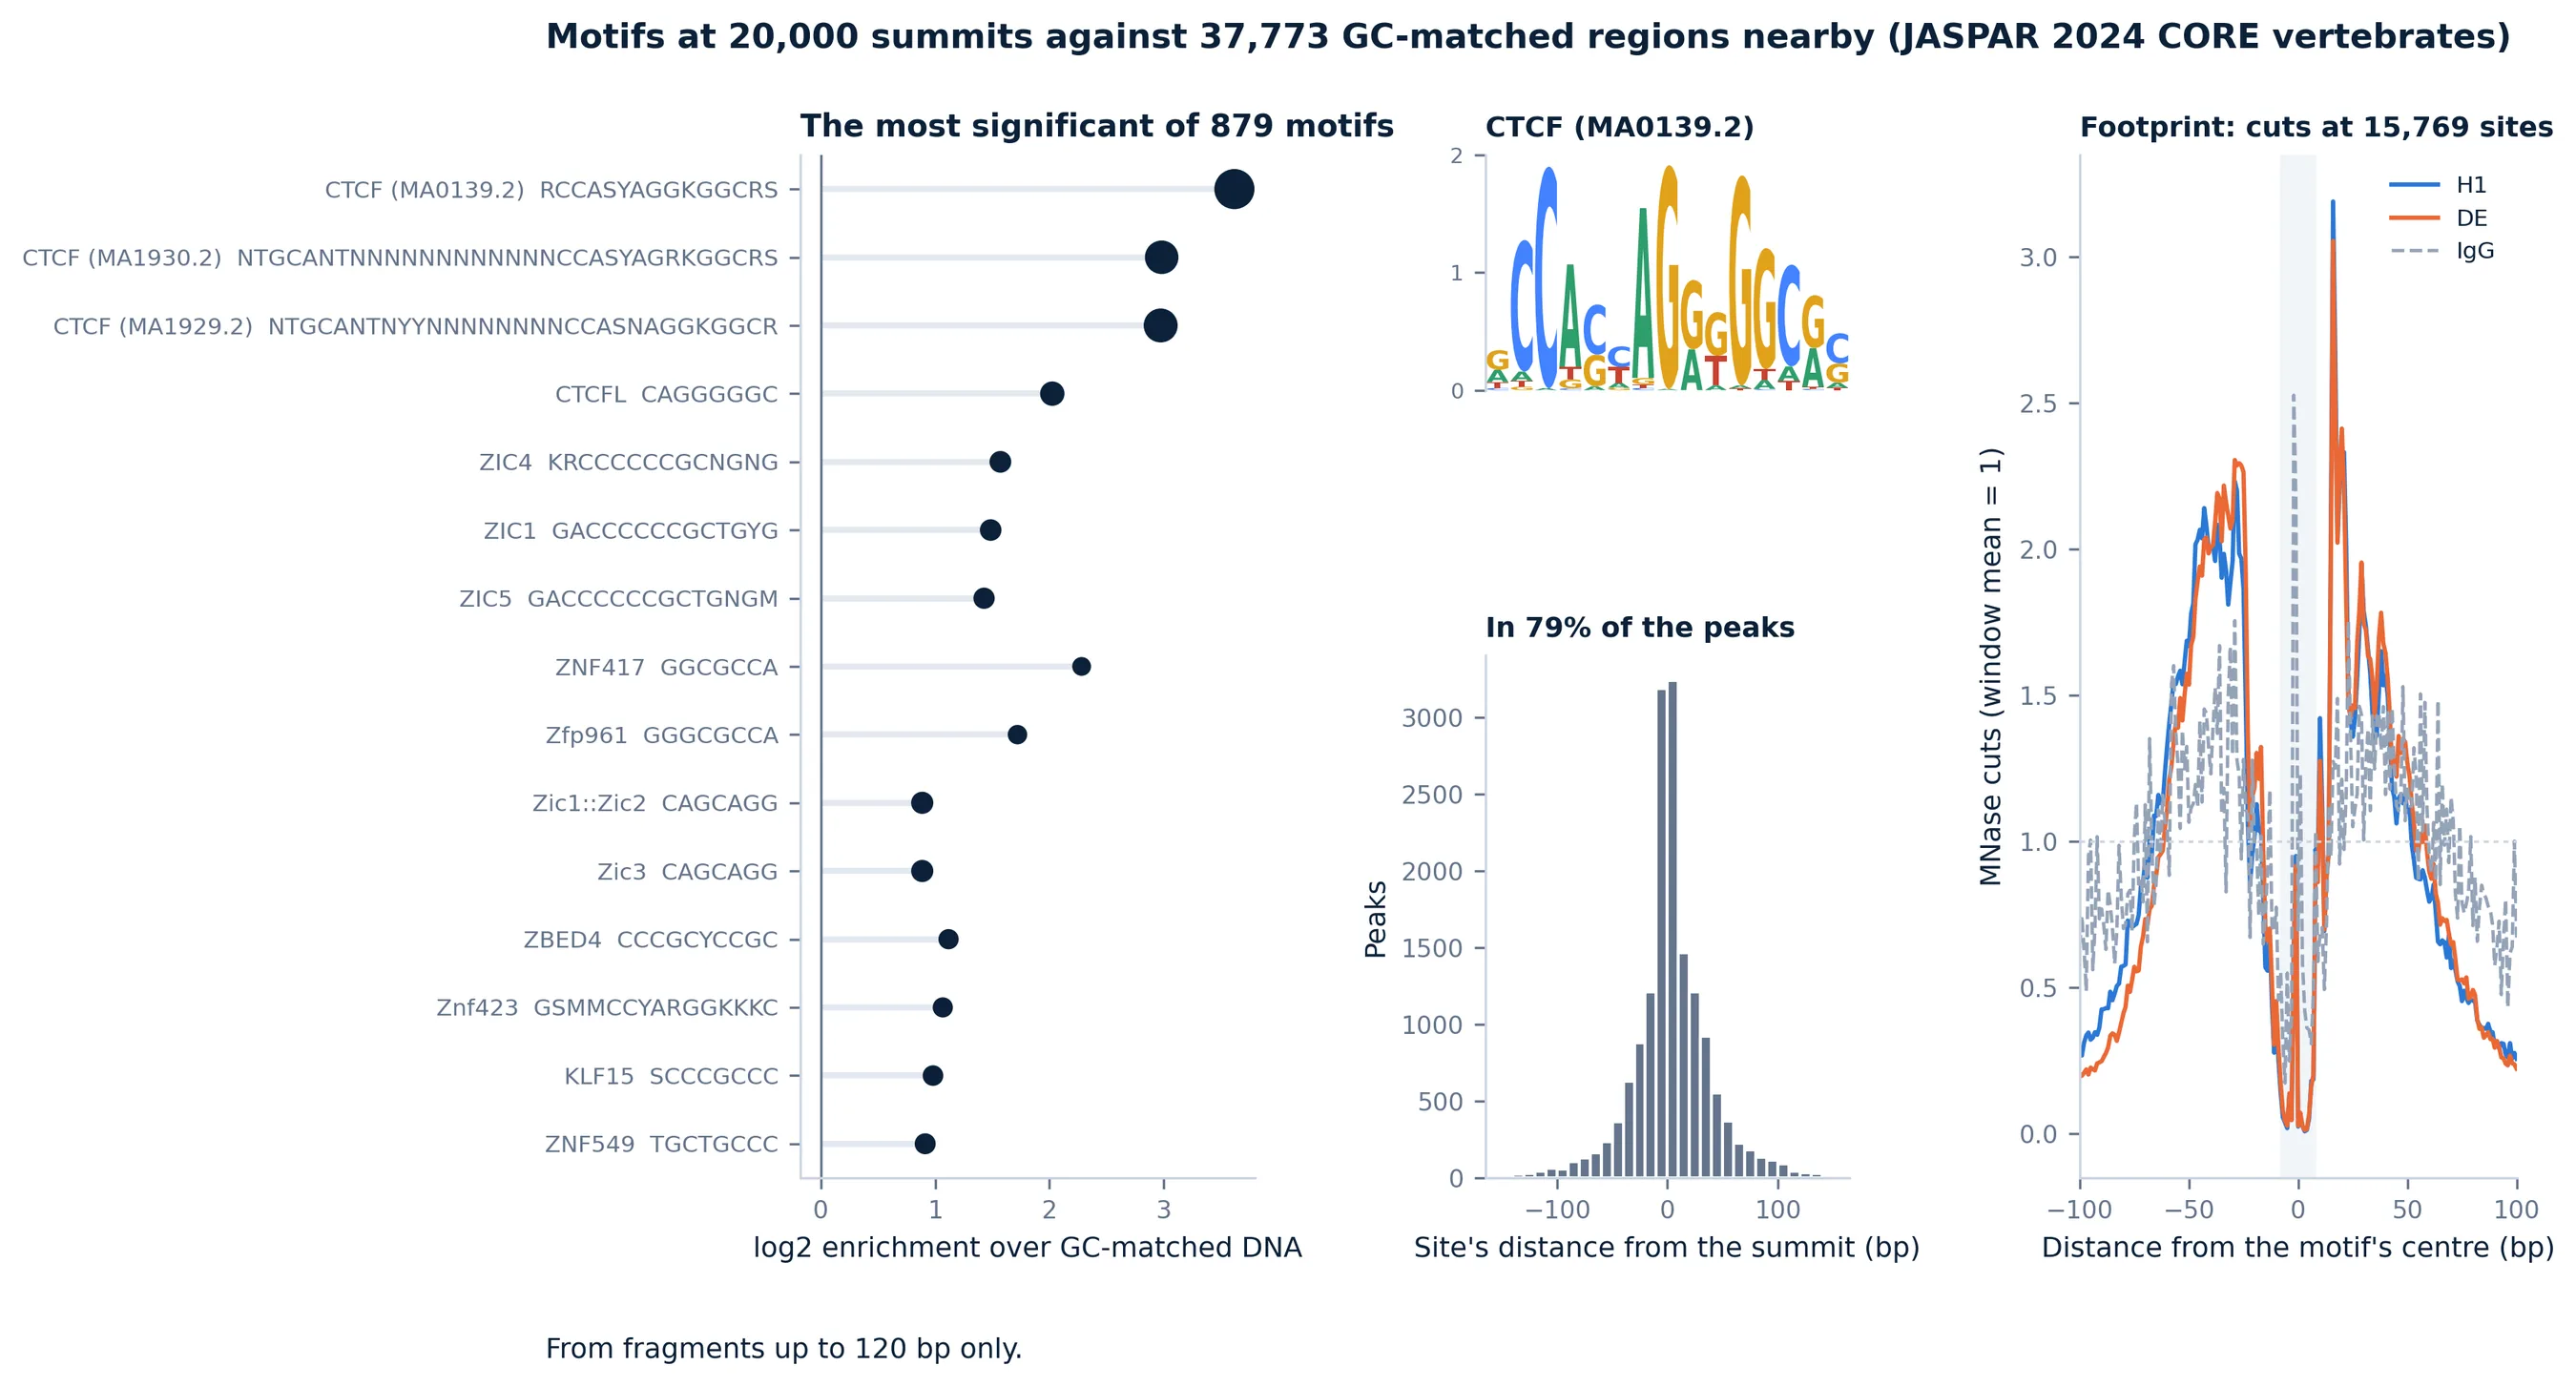
For a transcription factor, Motifs and Footprints asks whether the peaks hold the factor's motif and whether the factor shields it. Each JASPAR 2024 CORE motif (879 for vertebrates) is looked for in the summit ±100 bp of the strongest 20,000 peaks and in regions 3 and 6 kb either side, the background drawn to the peaks' GC content as HOMER does; a one-sided Fisher test, Benjamini-Hochberg. Around each site of the motif shown, the MNase cuts (both ends of every fragment, the motif's strand read forward) are counted at each position out to 100 bp, as CUT&RUNTools does: a bound factor keeps the cuts off its own bases, so the profile dips over the motif and rises either side. The IgG controls' cuts at the same sites show what MNase's own preference for A/T-rich DNA puts there. Name motifs in the step's text box (a JASPAR name such as CTCF, or an id) to draw theirs; a histone mark has no motif to find.
Library QC, signal and what changes
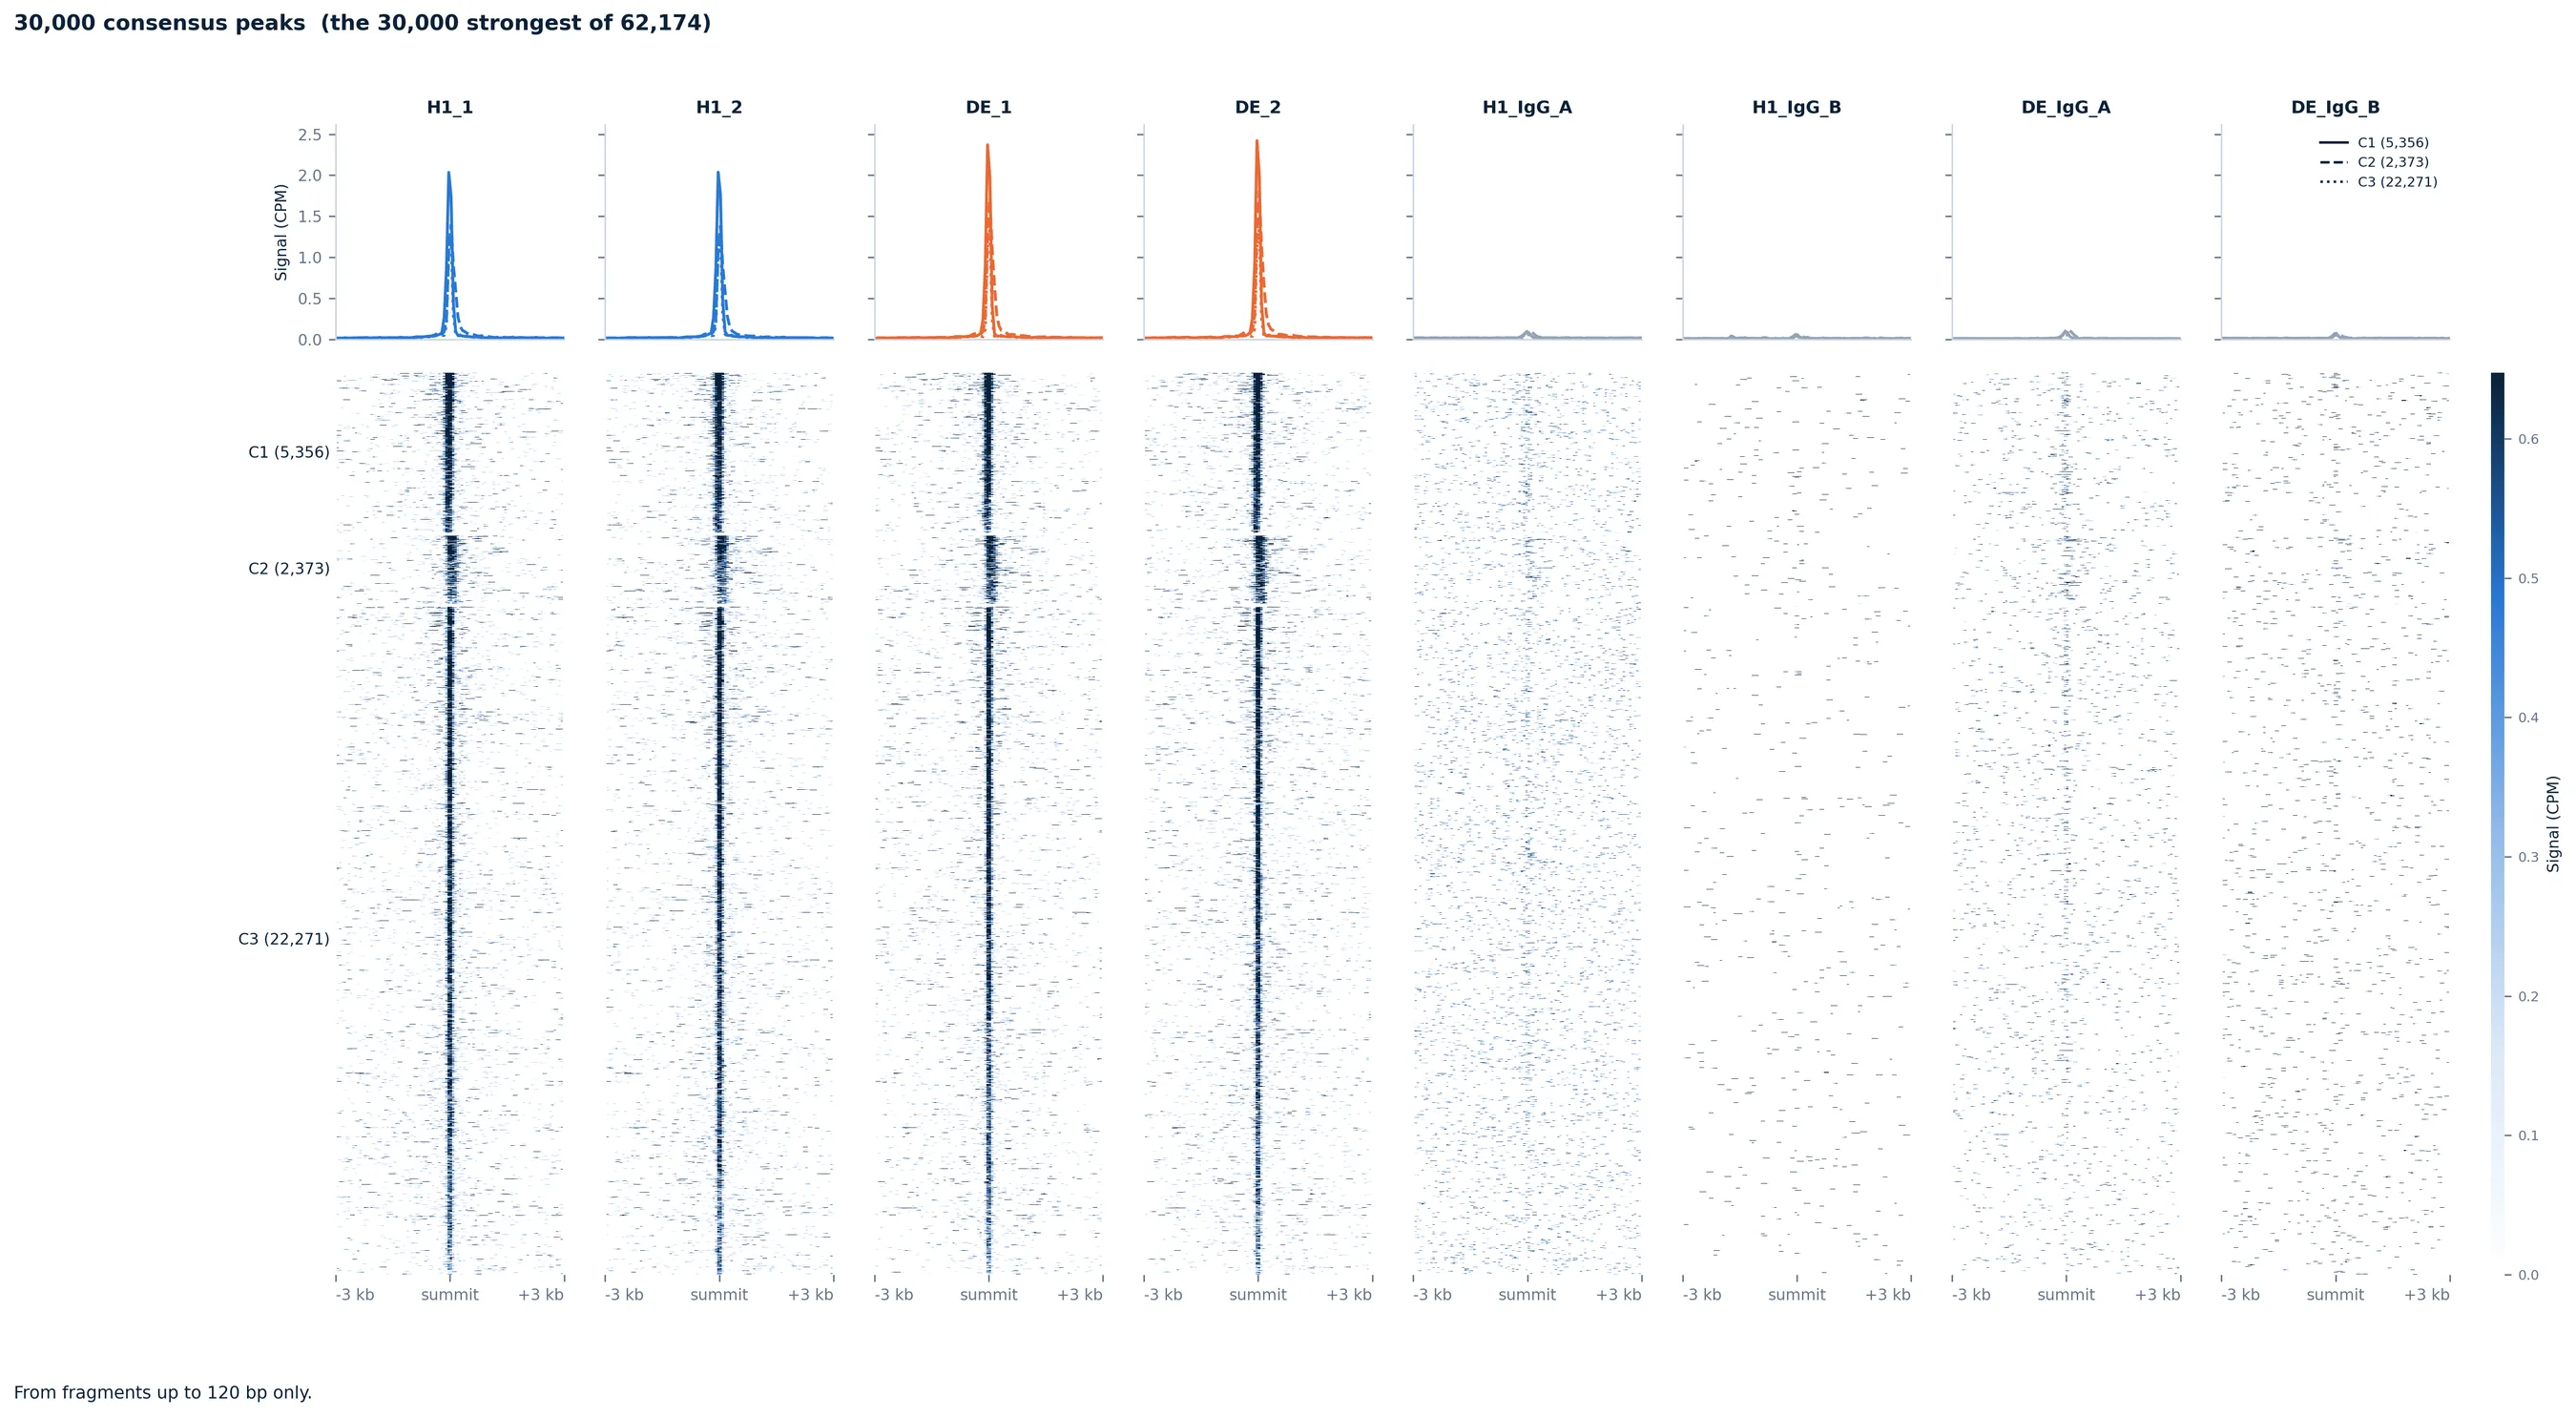
These are CUT&Tag's steps, read on the fragments chosen: see CUT&Tag for how peaks are called, the normalizations, Library QC's panels, the signal heatmaps, Differential Binding and Genome Tracks.
Sample datasets
Browse Sample Datasets in a CUT&RUN session lists two transcription factors, each in two conditions with replicates and IgG controls: CTCF in H1 embryonic stem cells against the definitive endoderm made from them (Meers et al. 2019, GSE128499, hg19), and the vitamin D receptor in endometrial stromal cells treated with calcitriol or the vehicle (Yi et al. 2026, GSE306127, hg38). Each keeps a random 3.5 million fragments of every sample (2 million of every IgG), the depth CUT&RUN asks for.
Sample metadata
As in bulk RNA-seq, the metadata editor asks for a condition per sample. IgG controls are not samples: they do not appear in it.
Step reference
| Step | Stage | What it does | You get | Key inputs |
|---|---|---|---|---|
| Data Upload | Setup | Reads one file of fragments per sample, sets apart chrM, the spike-in genome and unplaced contigs, removes the ENCODE blacklist and the CUT&RUN suspect list, finds the genome build, calls every sample's peaks and counts the fragments over the consensus. | Fragments per sample and what was set apart, and the fragment lengths with the factors' band and the nucleosome ladder. | BAM, fragment BED or BEDPE files (see What to upload). |
| Library QC | QC | Checks every library and IgG control: the fingerprint, FRiP, TSS enrichment, fragments, peaks, duplicates, chrM and the share of fragments up to 120 bp. Flags fewer than 3 million fragments, FRiP under 0.01, over 20% duplicates, and a FRiP under twice the IgG's. | The panels with the samples in one order, the flagged ones marked, and a table per sample. | Group by. |
| Peak Calling | QC | Calls the peaks again with another threshold, consensus rule or without the IgG, from all the fragments or those of one length, and counts them over the new consensus. | Each sample's signal blocks and its cut-off, peaks per sample, their widths and how many samples call each region. | Threshold, Consensus, IgG controls, Fragments. |
| Sample Similarity | QC | Correlates the samples over the most variable consensus peaks (log2, normalized), clusters them and runs a PCA. | A clustered correlation heatmap with each sample's group, and the first two principal components. | Group by, Normalization, Peaks used. |
| Signal at Genes | Analysis | Each sample's signal around every gene's TSS, or across gene bodies, as deepTools draws it, from the fragments chosen. | Heatmaps with mean profiles, one column per sample or group, genes sorted by signal. | Region, Window, Show, Group by, Normalization, Genome build, Fragments. |
| Signal at Peaks | Analysis | The signal around every consensus peak's summit, the peaks clustered by their pattern across samples, or the peaks Differential Binding called, from the fragments chosen. | Heatmaps with a mean profile per cluster, and each peak's cluster and signal as a table. | Peaks, Clusters, Window, Show, Group by, Normalization, Fragments. |
| Peak Overlap | Analysis | Compares the samples' own peaks: the base-pair Jaccard of every pair, and which samples call the same regions. | A Jaccard heatmap and an UpSet plot. | Group by. |
| Peak Annotation | Analysis | Annotates every peak with its nearest gene and where it lies (promoter, exon, intron, downstream, distal). | Where each sample's peaks lie, their distance to the nearest TSS and their widths. | Group by, Genome build. |
| Motifs and Footprints | Analysis | Tests the summits for JASPAR motifs against GC-matched DNA nearby, and draws the factor's footprint: the MNase cuts around its motif's sites, which a bound factor keeps off its own bases. | The most enriched motifs, then for each motif shown its logo, where its sites sit against the summits, and its footprint per group with the IgG beside it. | Fragments, Group by, Genome build; motifs by name in your own words. |
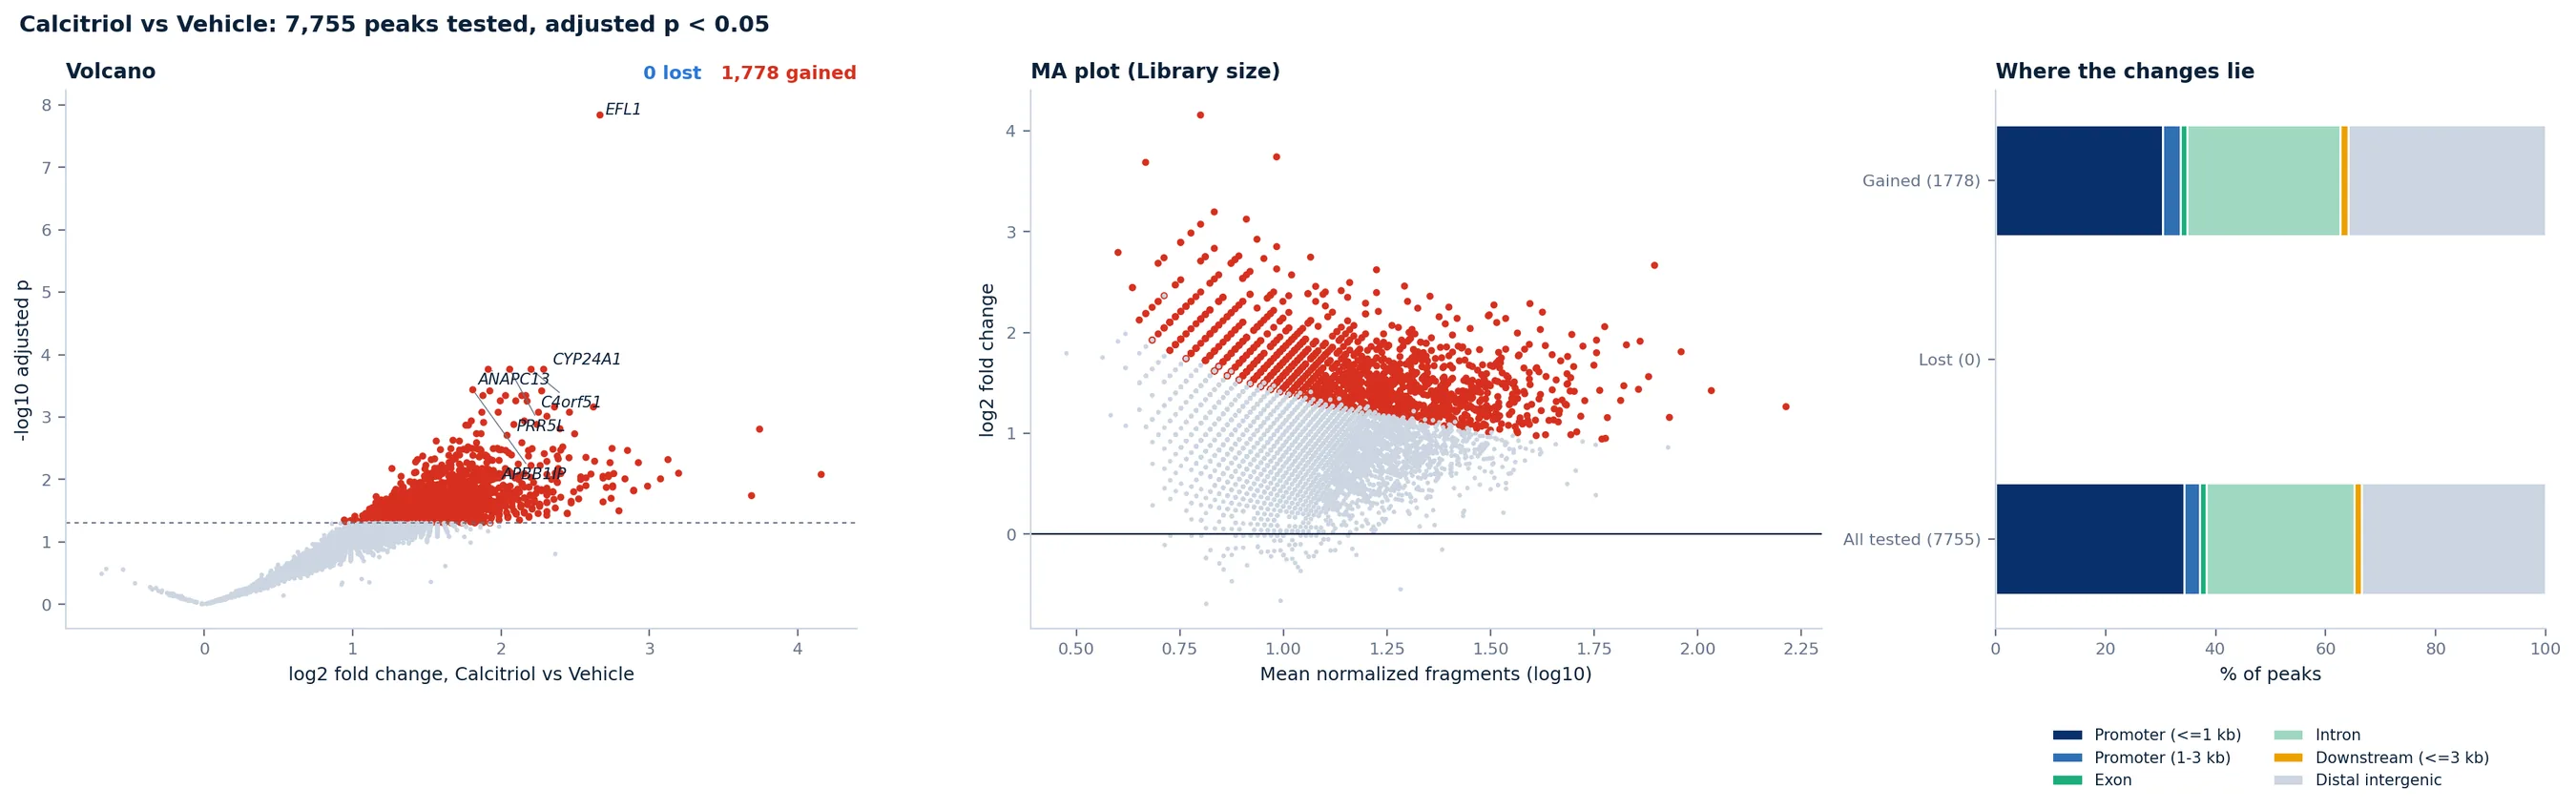
| Differential Binding | Analysis | Tests every consensus peak for more or less signal between two groups with DESeq2, as DiffBind does, normalized by library size, by reads in peaks or by the spike-in. | A volcano, an MA plot and where the gained and lost peaks lie, and a table of every peak tested. | Parameter to compare, two values, Normalization, Minimum fold change. |
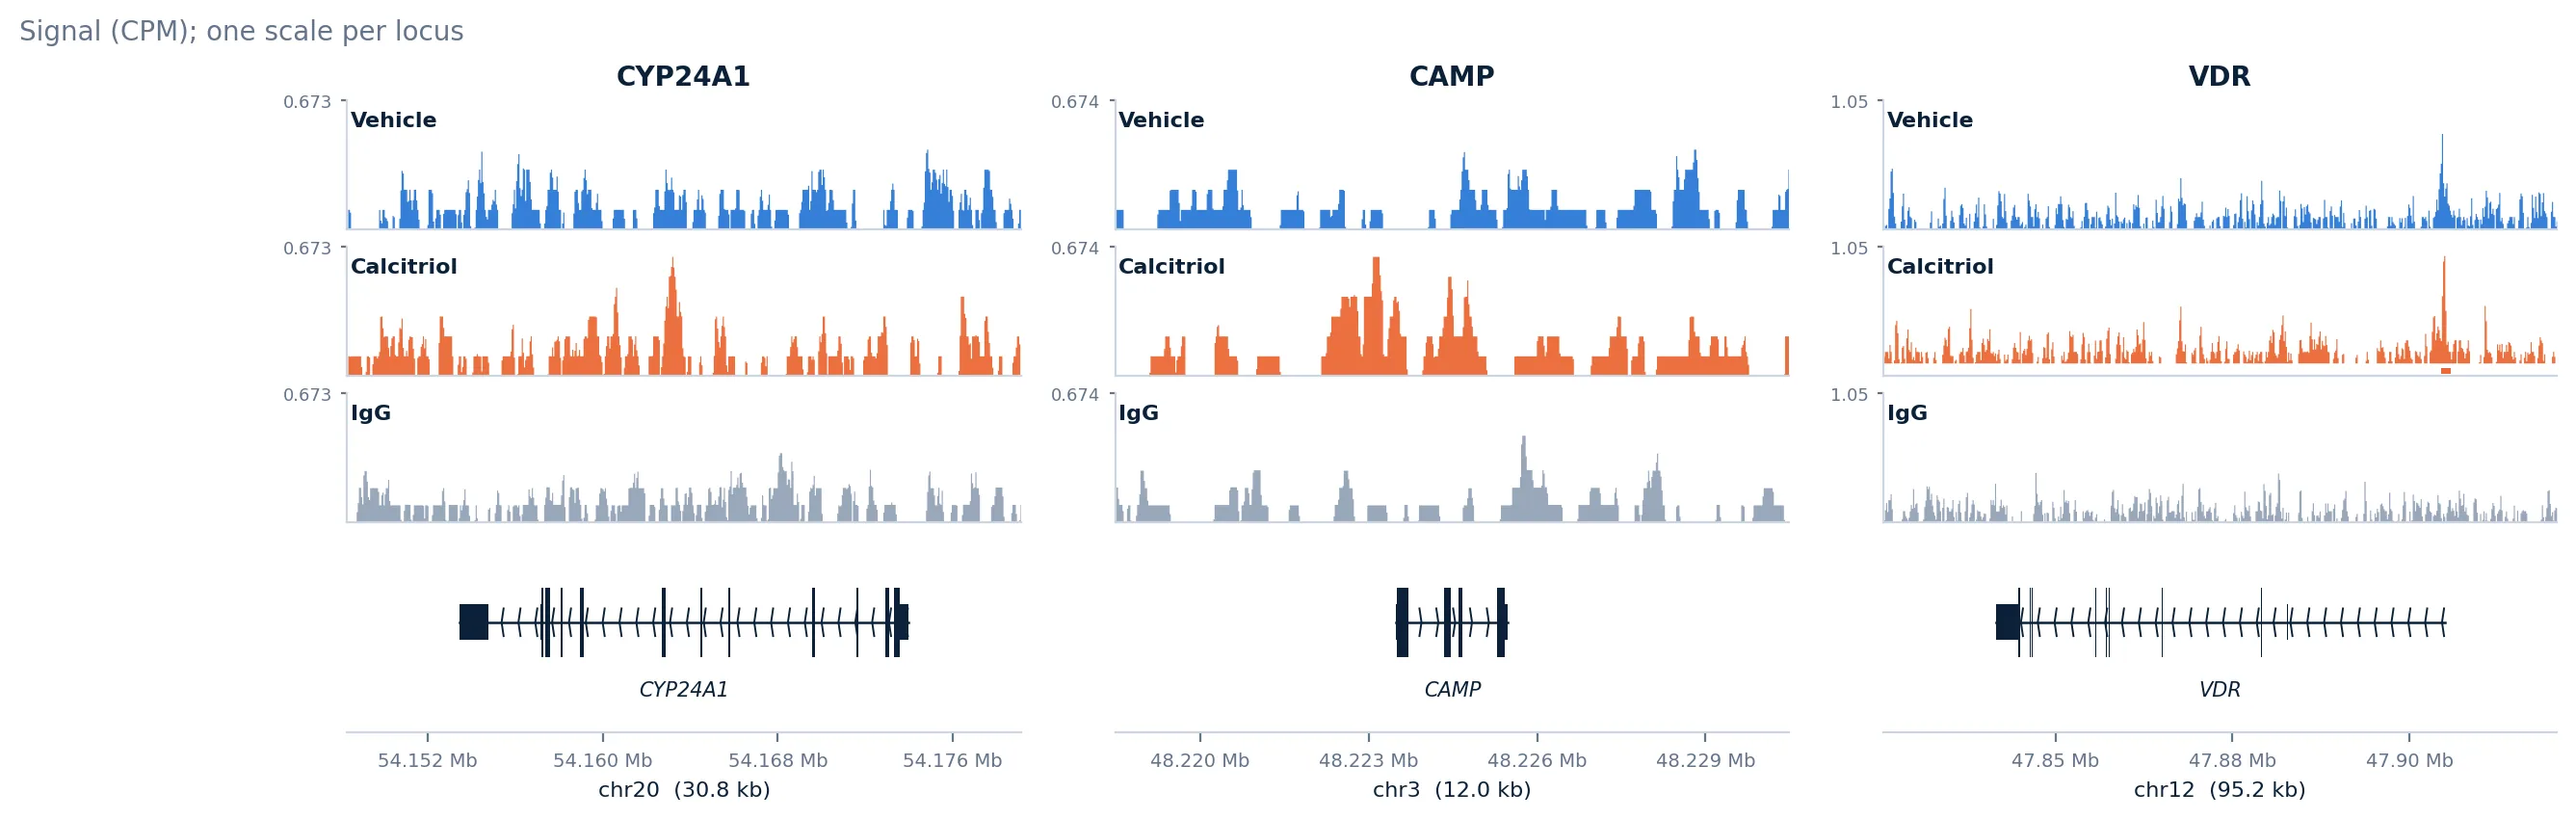
| Genome Tracks | Analysis | Shows the signal at the genes or regions you name, or the strongest changes, as genome browser tracks, from the fragments chosen. | One track per sample or group on one scale per locus, the peaks, the genes and the differential peaks shaded. | Show, Group by, Normalization, Genome build, Fragments; genes or regions in your own words. |
On Meers et al.'s CTCF CUT&RUN (GEO GSE128499) the upload finds hg19 from the fragments alone. With Peak Calling on fragments up to 120 bp, Motifs and Footprints ranks CTCF's motif first (12.3-fold, in 79% of the summits against 6% of GC-matched DNA nearby, 87% of its sites within 50 bp of the summit), with its footprint in both stages (log2 −1.4 over the motif) and next to none in the IgG controls (−0.3); Differential Binding finds 202 sites gained in endoderm and 119 lost. On Yi et al.'s VDR (GSE306127), without its ligand VDR binds about 700 sites per sample and Library QC flags those samples (FRiP 0.003, under twice the IgG's); with calcitriol about 10,000, and Differential Binding finds 1,778 of 7,755 peaks gained and none lost, CYP24A1 among them. For a factor's motif the fragments matter: from all of them GC-rich promoter motifs lead and VDR's own (RXRA::VDR) is 1.8-fold enriched; from those up to 120 bp it is 5.3-fold, behind AP-1's. Every step also runs on simulated libraries with a known answer (a factor at 300 sites holding its motif and leaving its footprint), and in a kernel set up as the server's sandbox has it.