
ChIP-seq
A ChIP-seq analysis takes the reads an antibody pulled down beside the input, judges every library by ENCODE's standards, calls peaks against the input, and finds where a factor or mark binds, how that changes between conditions, its motif, its super-enhancers and the genes it regulates.
Start a ChIP-seq analysis
In a project, click New session and choose ChIP-seq as the kind of analysis. Chromatin immunoprecipitation pulls down the DNA a protein sits on; sequenced beside the input (the chromatin before the pull-down), the protein's sites stand out as piles of reads the input does not have. Every method below follows ENCODE's ChIP-seq standards (Landt et al. 2012) and the tools the field uses.
What to upload
One file of aligned reads per library: a BAM (single- or paired-end, as Bowtie 2, BWA or
nf-core/chipseq leave it), ENCODE's tagAlign, or a fragment BED or BEDPE. A library
with input, WCE or IgG in its name is a control, and each ChIP library is
compared with the inputs whose names share most of its words (MCF7_ER_E2_rep1 with
MCF7_input_E2); "ctrl" and "control" name a condition, not an input. MACS narrowPeak or broadPeak files
named like their library are used instead of calling its peaks, and a GTF of the genes is optional. Spike-in reads
(ChIP-Rx) are counted when they are on a Drosophila or E. coli genome in the BAM, or in a file named like the library
with spike-in. Import from GEO on the start screen lists a series' BAM, tagAlign and peak
files. Upload aligned reads: FASTQ files are not aligned for ChIP-seq yet.
How the reads become peaks
- Filtering, as ENCODE's pipeline filters: alignments under MAPQ 30 go, and chrM, spike-in and unplaced contigs are counted and set apart; the ENCODE blacklist (Amemiya et al. 2019) is removed when the genome build is known. Duplicates are found by position (a read's 5' end and strand, a pair's two ends) and removed after the library's complexity is measured: NRF (distinct positions over reads) and PBC1 and PBC2 (positions read once over those read once or more, and over those read twice).
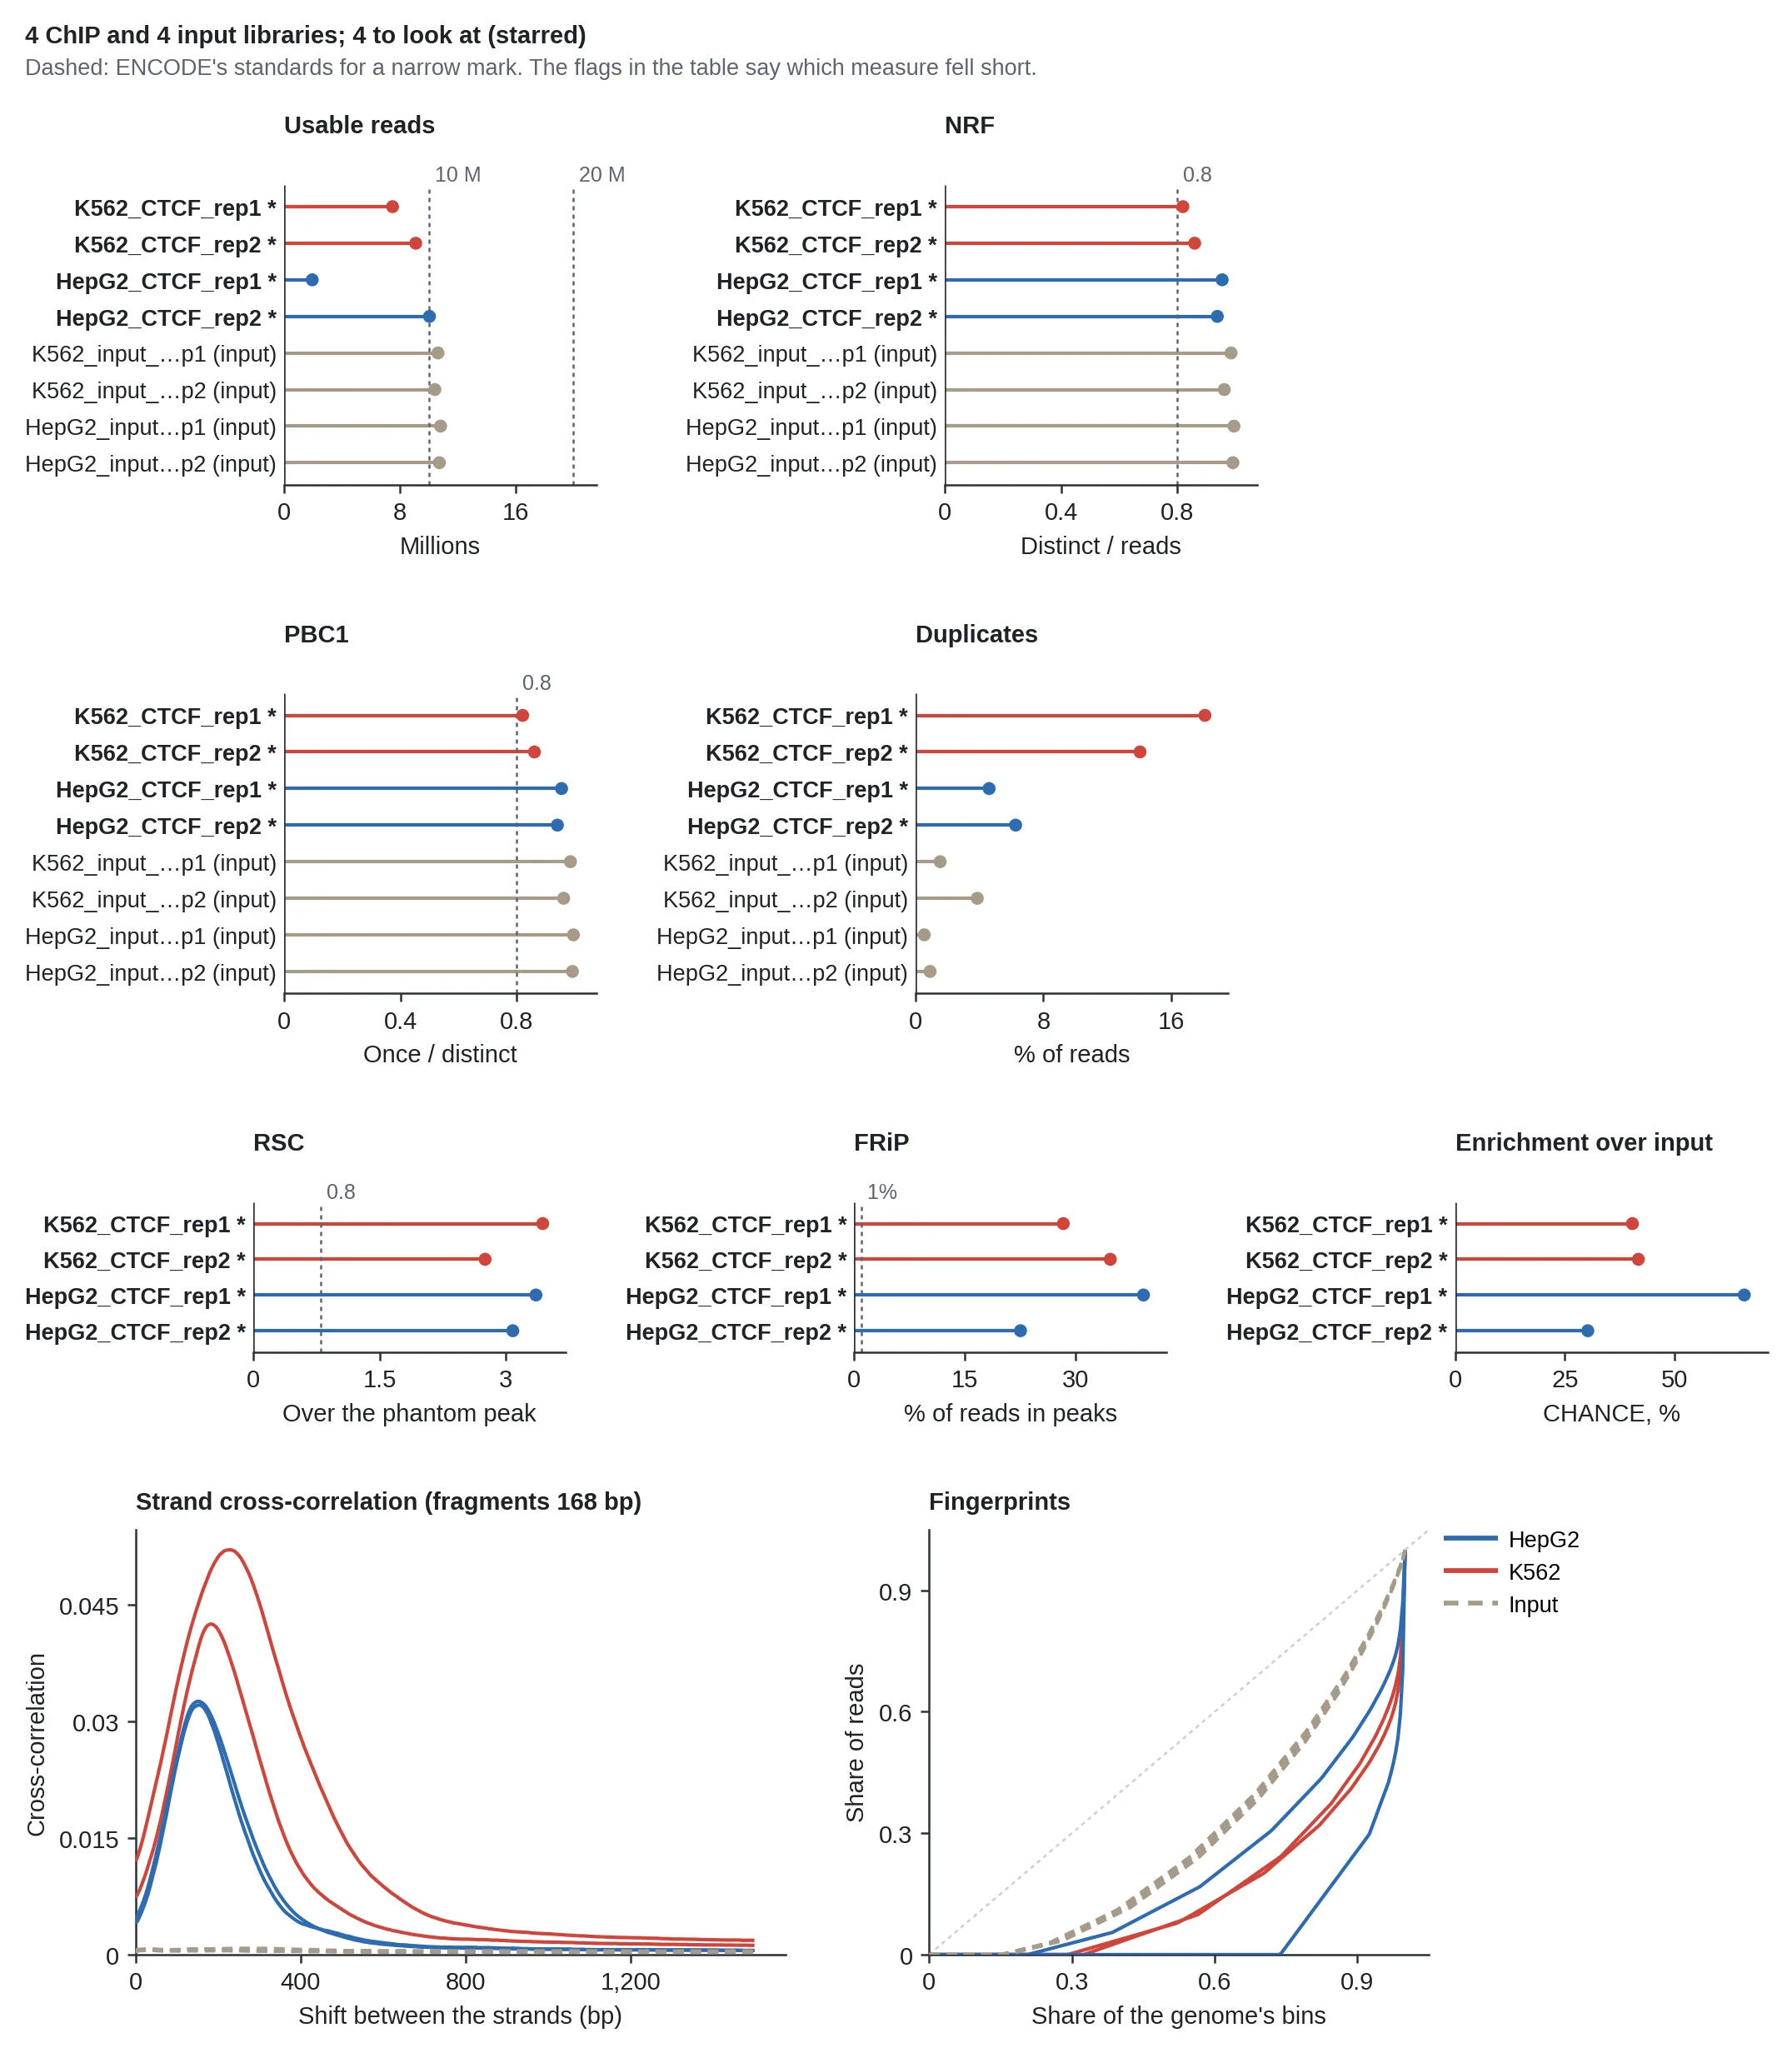
- Fragment length. A single-end read is one end of a fragment. Around a bound protein, reads on the plus strand pile up a fragment's length before those on the minus strand, so the two strands correlate best when shifted by it (Kharchenko et al. 2008). The upload finds that shift and extends every read to it. The curve's height there over the read-length "phantom" peak is RSC (ENCODE asks 0.8). Its height over the curve's floor, NSC, is reported but not judged: the floor comes mostly from reads in repeats, which ENCODE's phantompeakqualtools keeps and this pipeline leaves out, so the same library's NSC is 36 here and 3.3 in ENCODE's report, and cannot be held to ENCODE's 1.05. With no clear peak, MACS's 200 bp is used and the library flagged.
- Peaks, by MACS's model (Zhang et al. 2008): the ChIP's pileup against a Poisson whose mean is the local background, the highest of the genome-wide rate and the input's reads in 1 kb and 10 kb around each base; q-values over the genome's bases, q < 0.05. The inputs' hot spots, regions where an input has far more reads than a negative binomial allows (GreyListChIP, as DiffBind 3 applies it), are left out.
- Broad domains. A broad mark (H3K27me3, H3K36me3, H3K9me3, read from the libraries' names) covers
tens of kilobases thinly, so no single base stands out and a per-base test misses most of it. Such marks are called
as SICER and epic2 call them (Zang et al. 2009; Stovner and Sætrom 2019): the reads are counted in 200 bp
windows, windows with more reads than chance are joined into islands across gaps of up to 600 bp, an island is kept
when its score is one a random library of the same depth reaches no more than 1,000 times in a human genome
(SICER's E-value), and then only if it holds more reads than its input (a binomial test, FDR under 0.05). MACS's
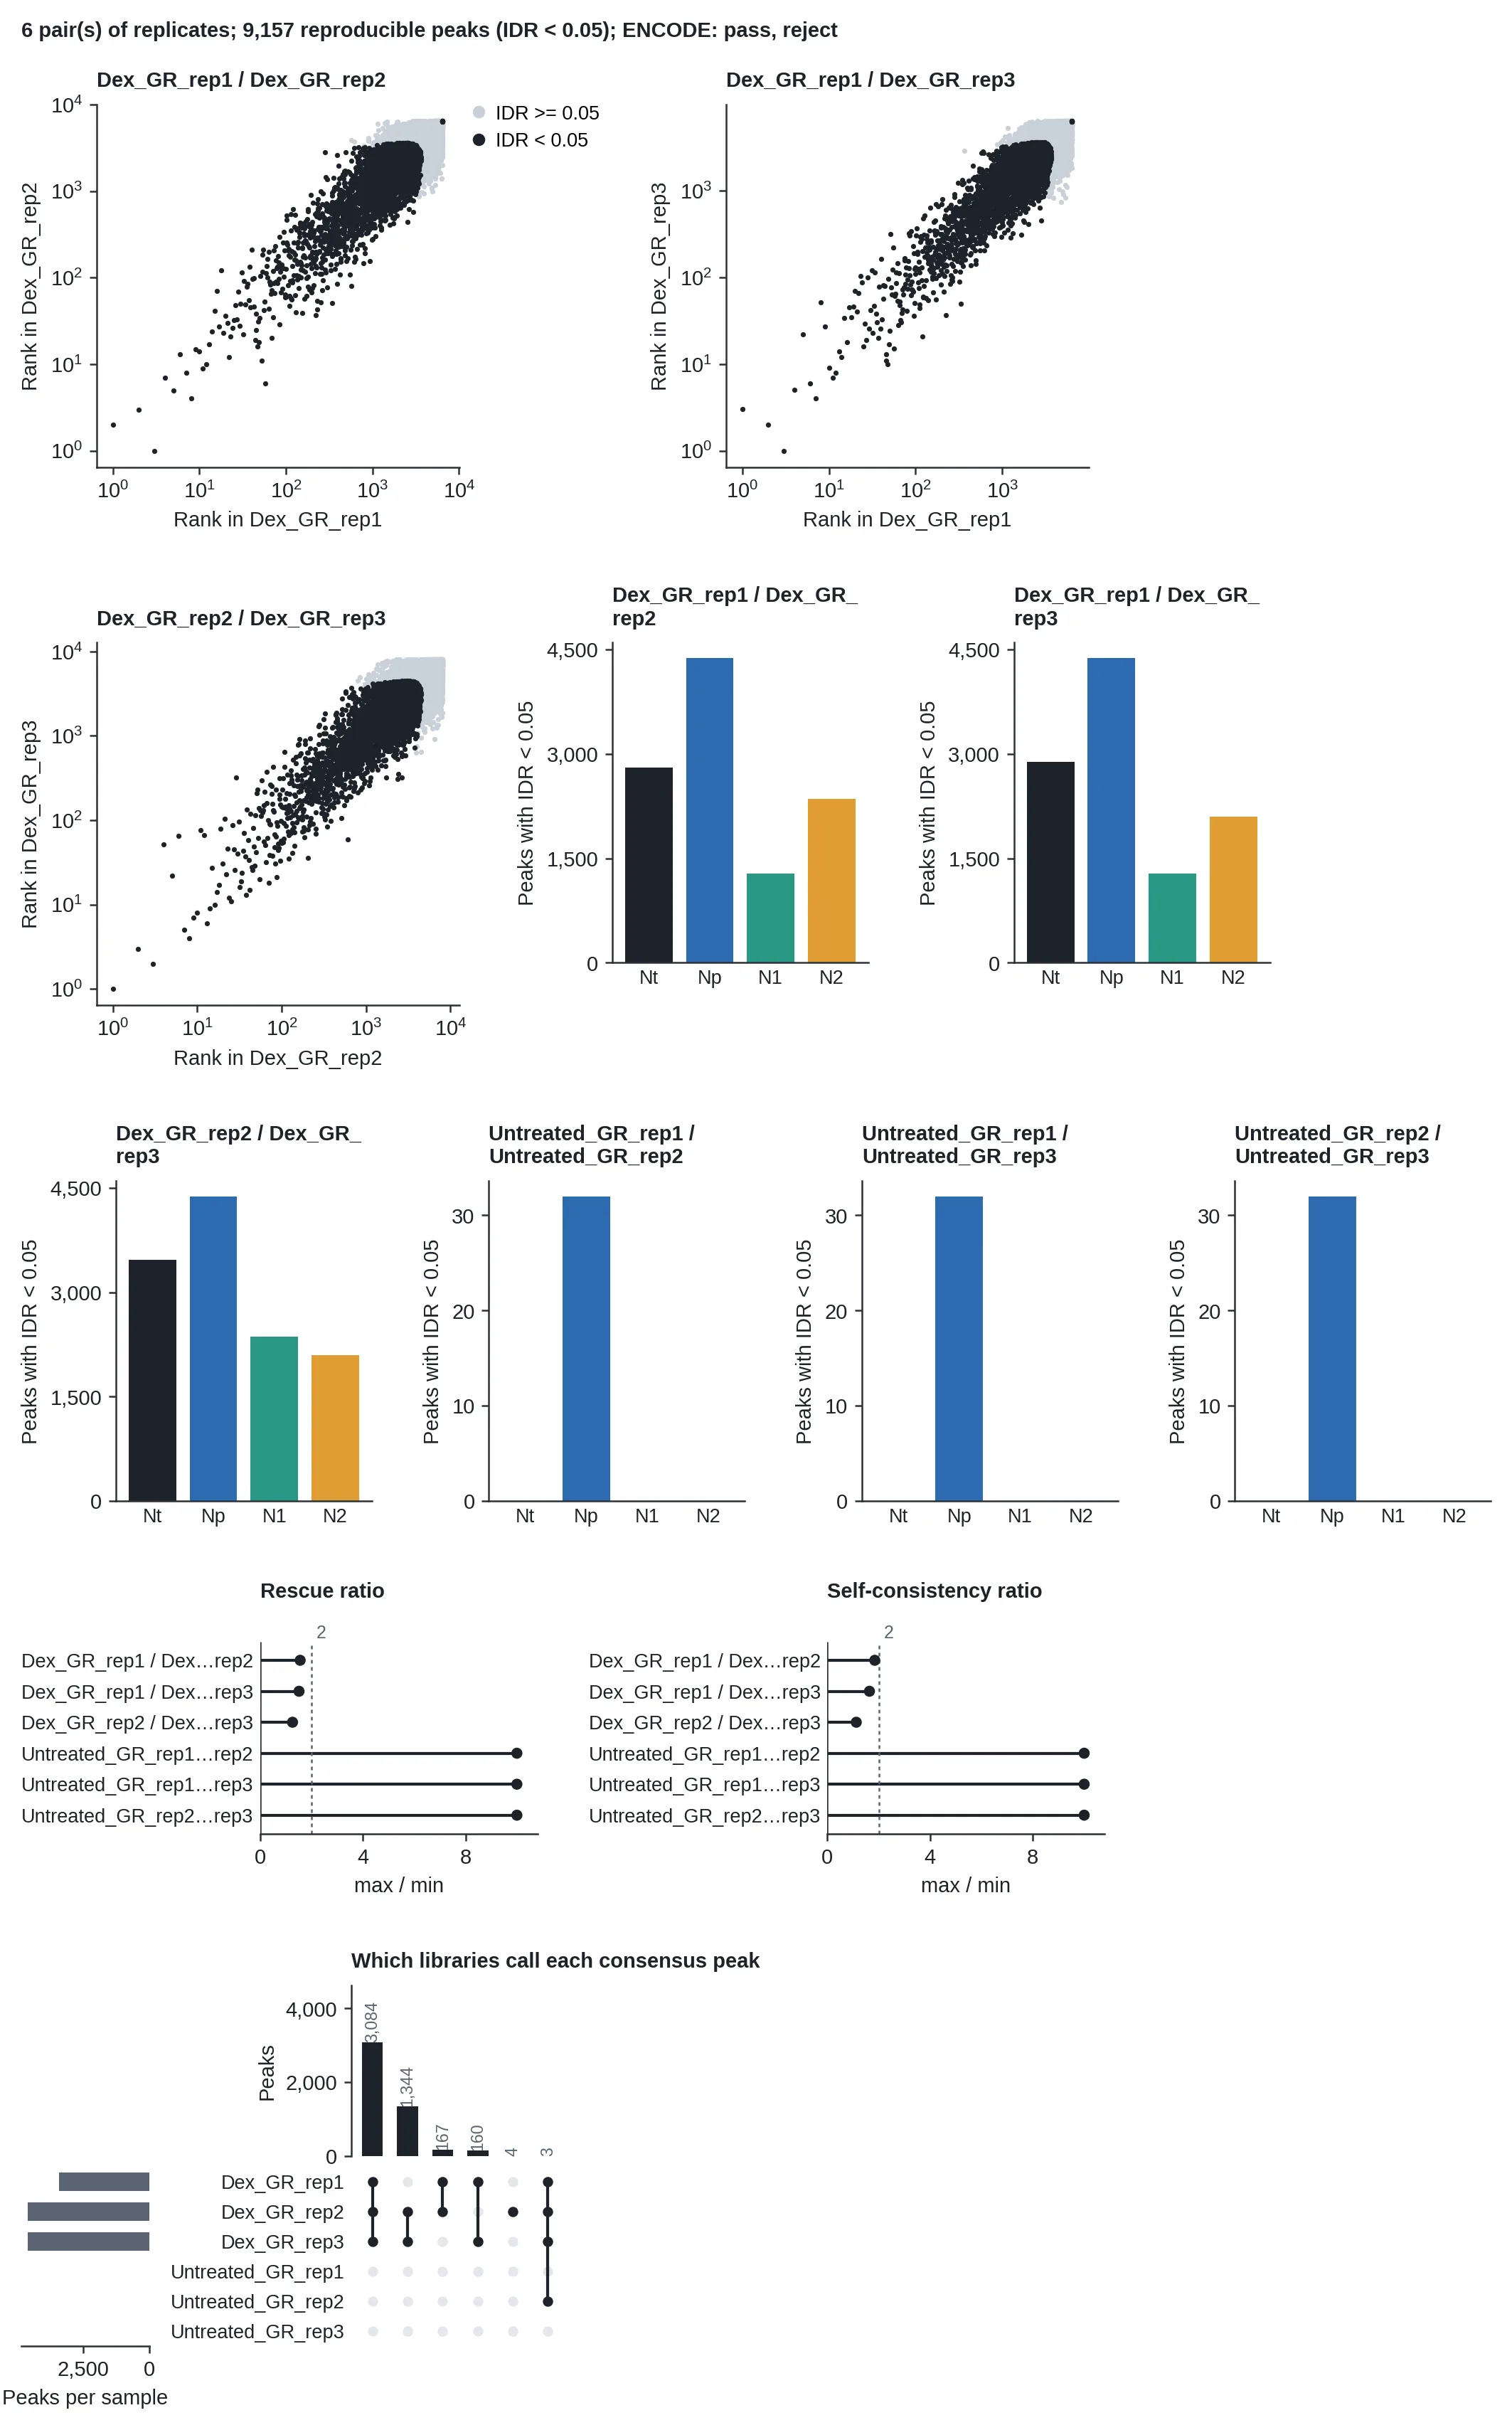
--broadis still a choice in Peak Calling. - Consensus, as DiffBind 3 takes it: the regions two libraries call, each re-centred on its strongest summit and 401 bp wide for a narrow mark. Peak Calling can take ENCODE's instead: the peaks two replicates agree on by IDR below 0.05 (Li et al. 2011).
Normalization and differential binding
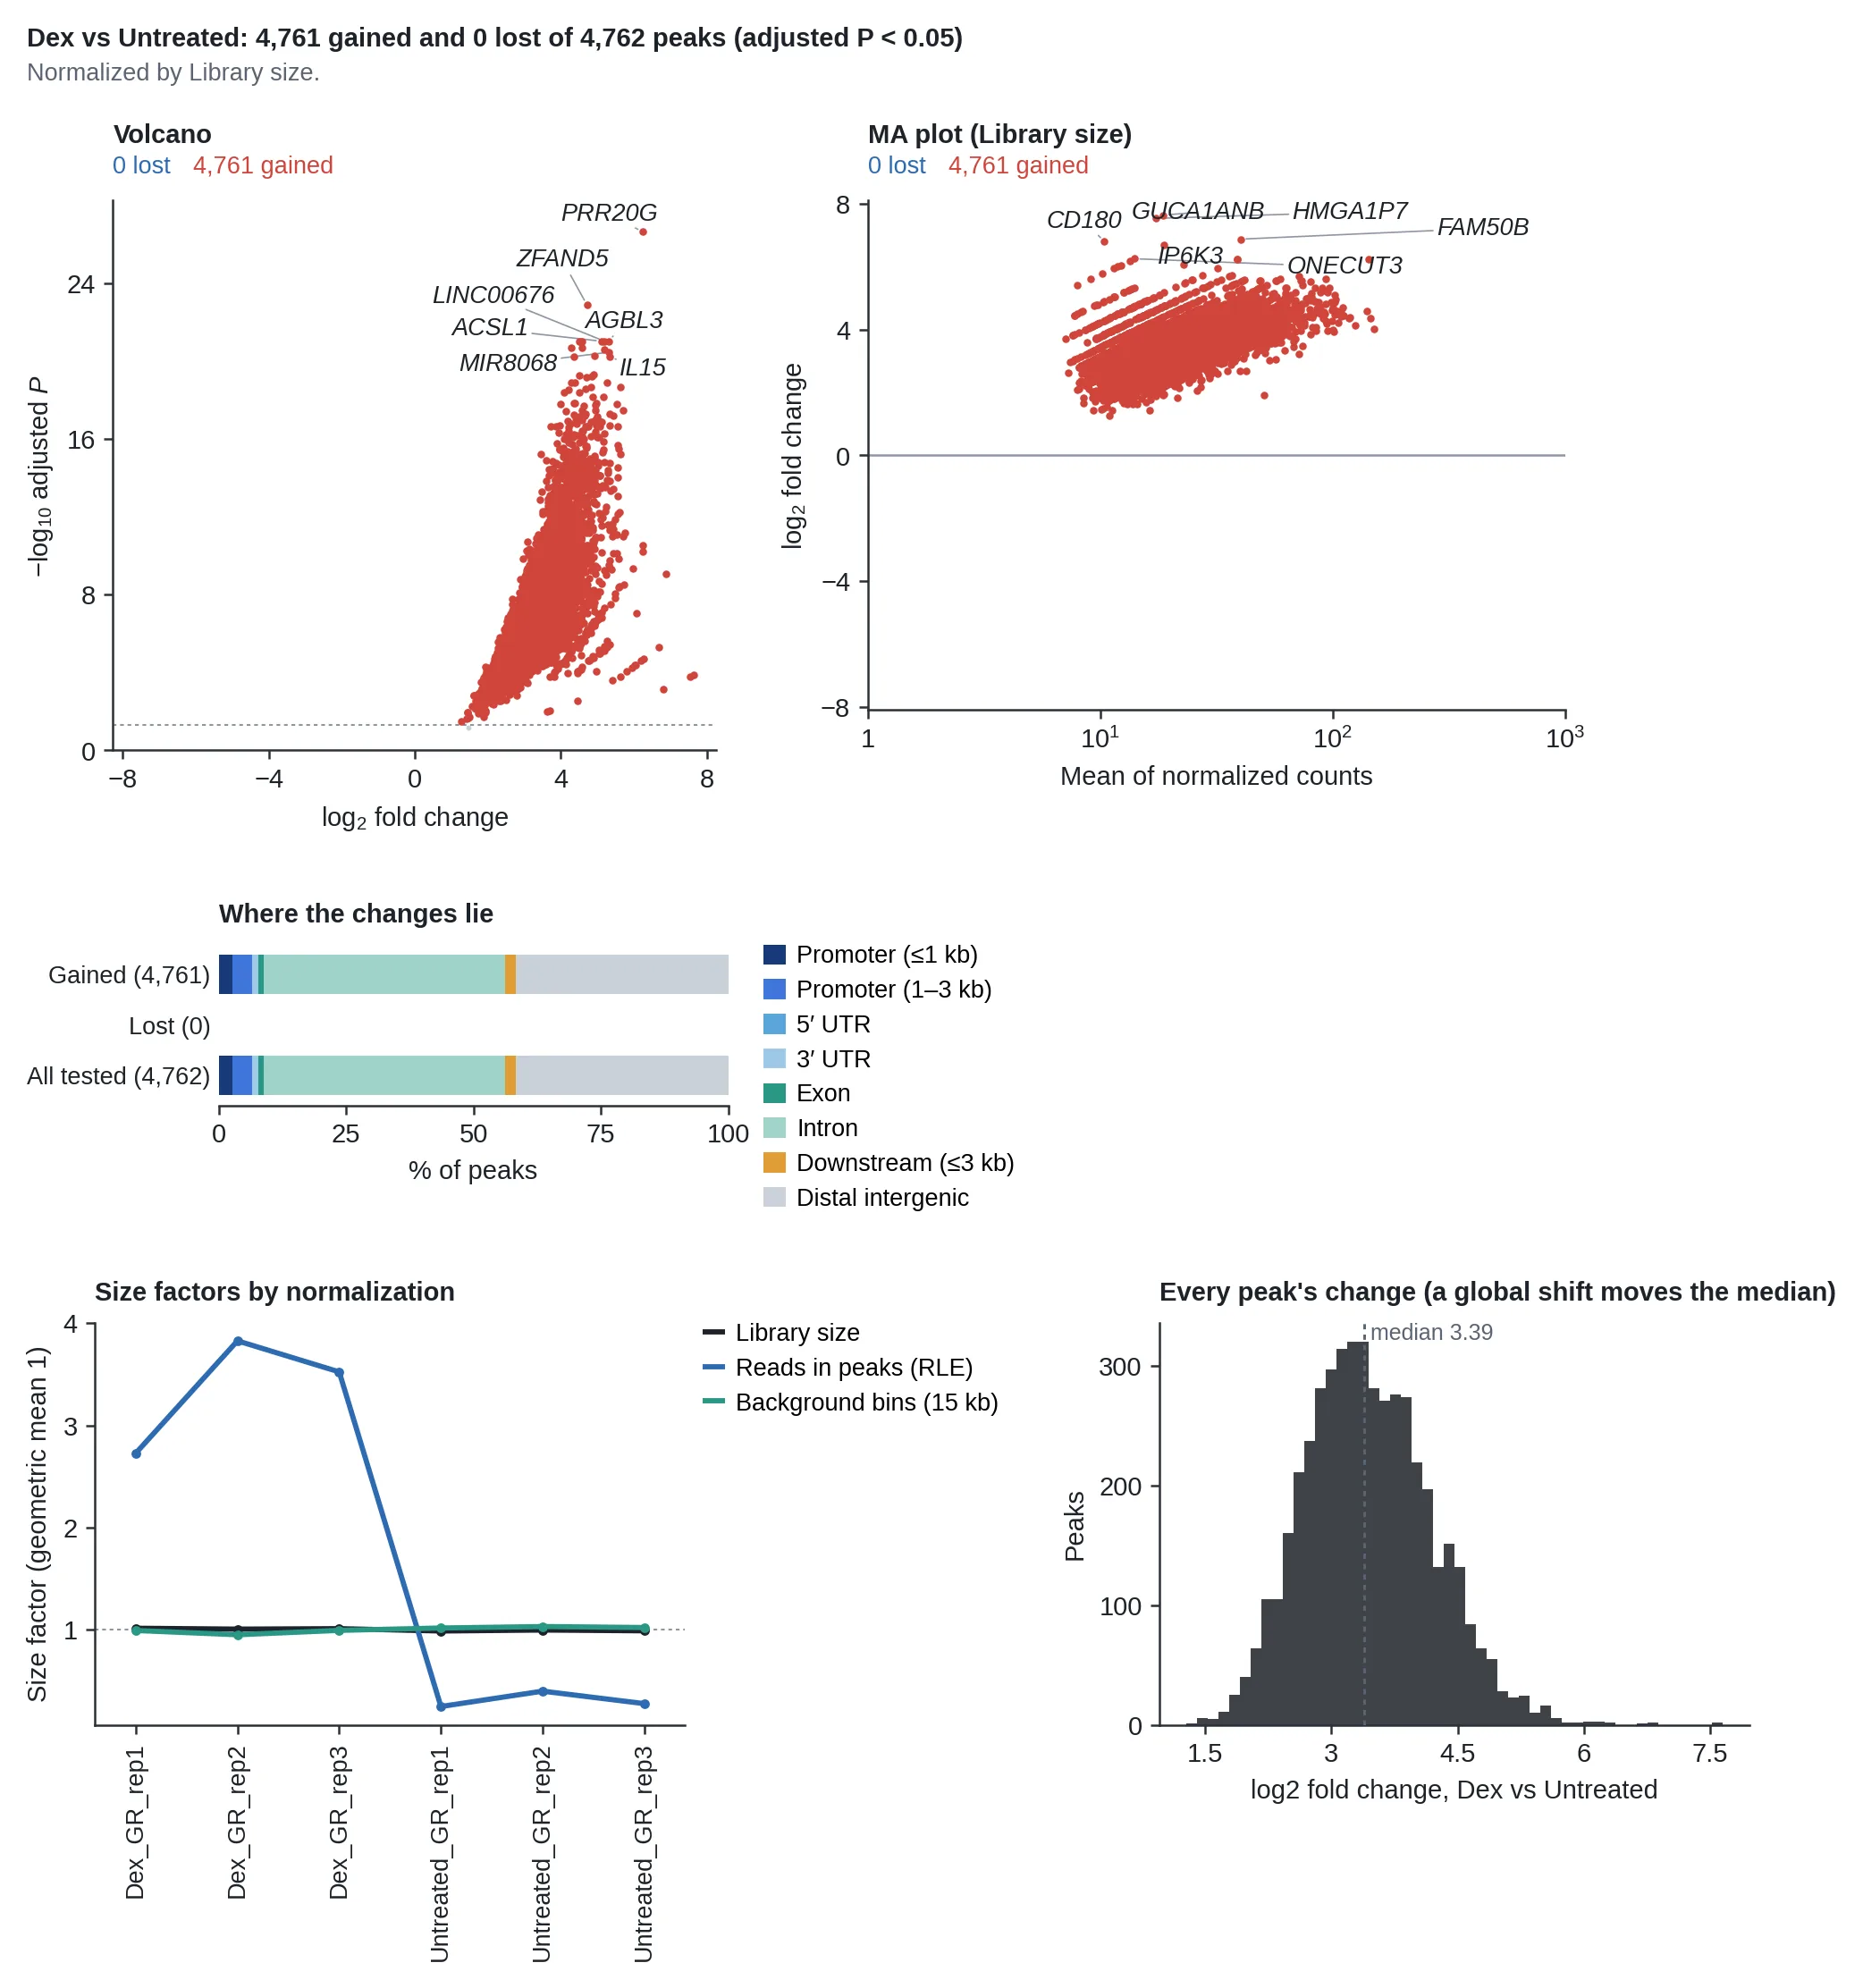
Differential Binding counts the reads in each consensus peak and compares two groups with DESeq2, as DiffBind 3 does. Which normalization is right depends on whether binding changed everywhere, so the figure shows every normalization's size factors side by side, and the fold change of every peak: if its median is far from zero, binding shifted globally.
- Library size (DiffBind 3's default) divides by each library's usable reads: a factor bound more everywhere shows as more.
- Reads in peaks (RLE), DESeq2's own, assumes most peaks do not change, and so hides a global change.
- Background bins divides by the reads in 15 kb bins across the genome, which a change in binding does not move.
- Spike-in (ChIP-Rx) divides by the spike-in chromatin's reads, the only way to see binding lost per cell when every peak loses it (Orlando et al. 2014).
Subtract the input takes each library's input reads in the peak, scaled to its depth, from its
own first (DiffBind's bSubControl); it is off by default because the greylist already removes the inputs'
hot spots.
Motifs, super-enhancers and target genes
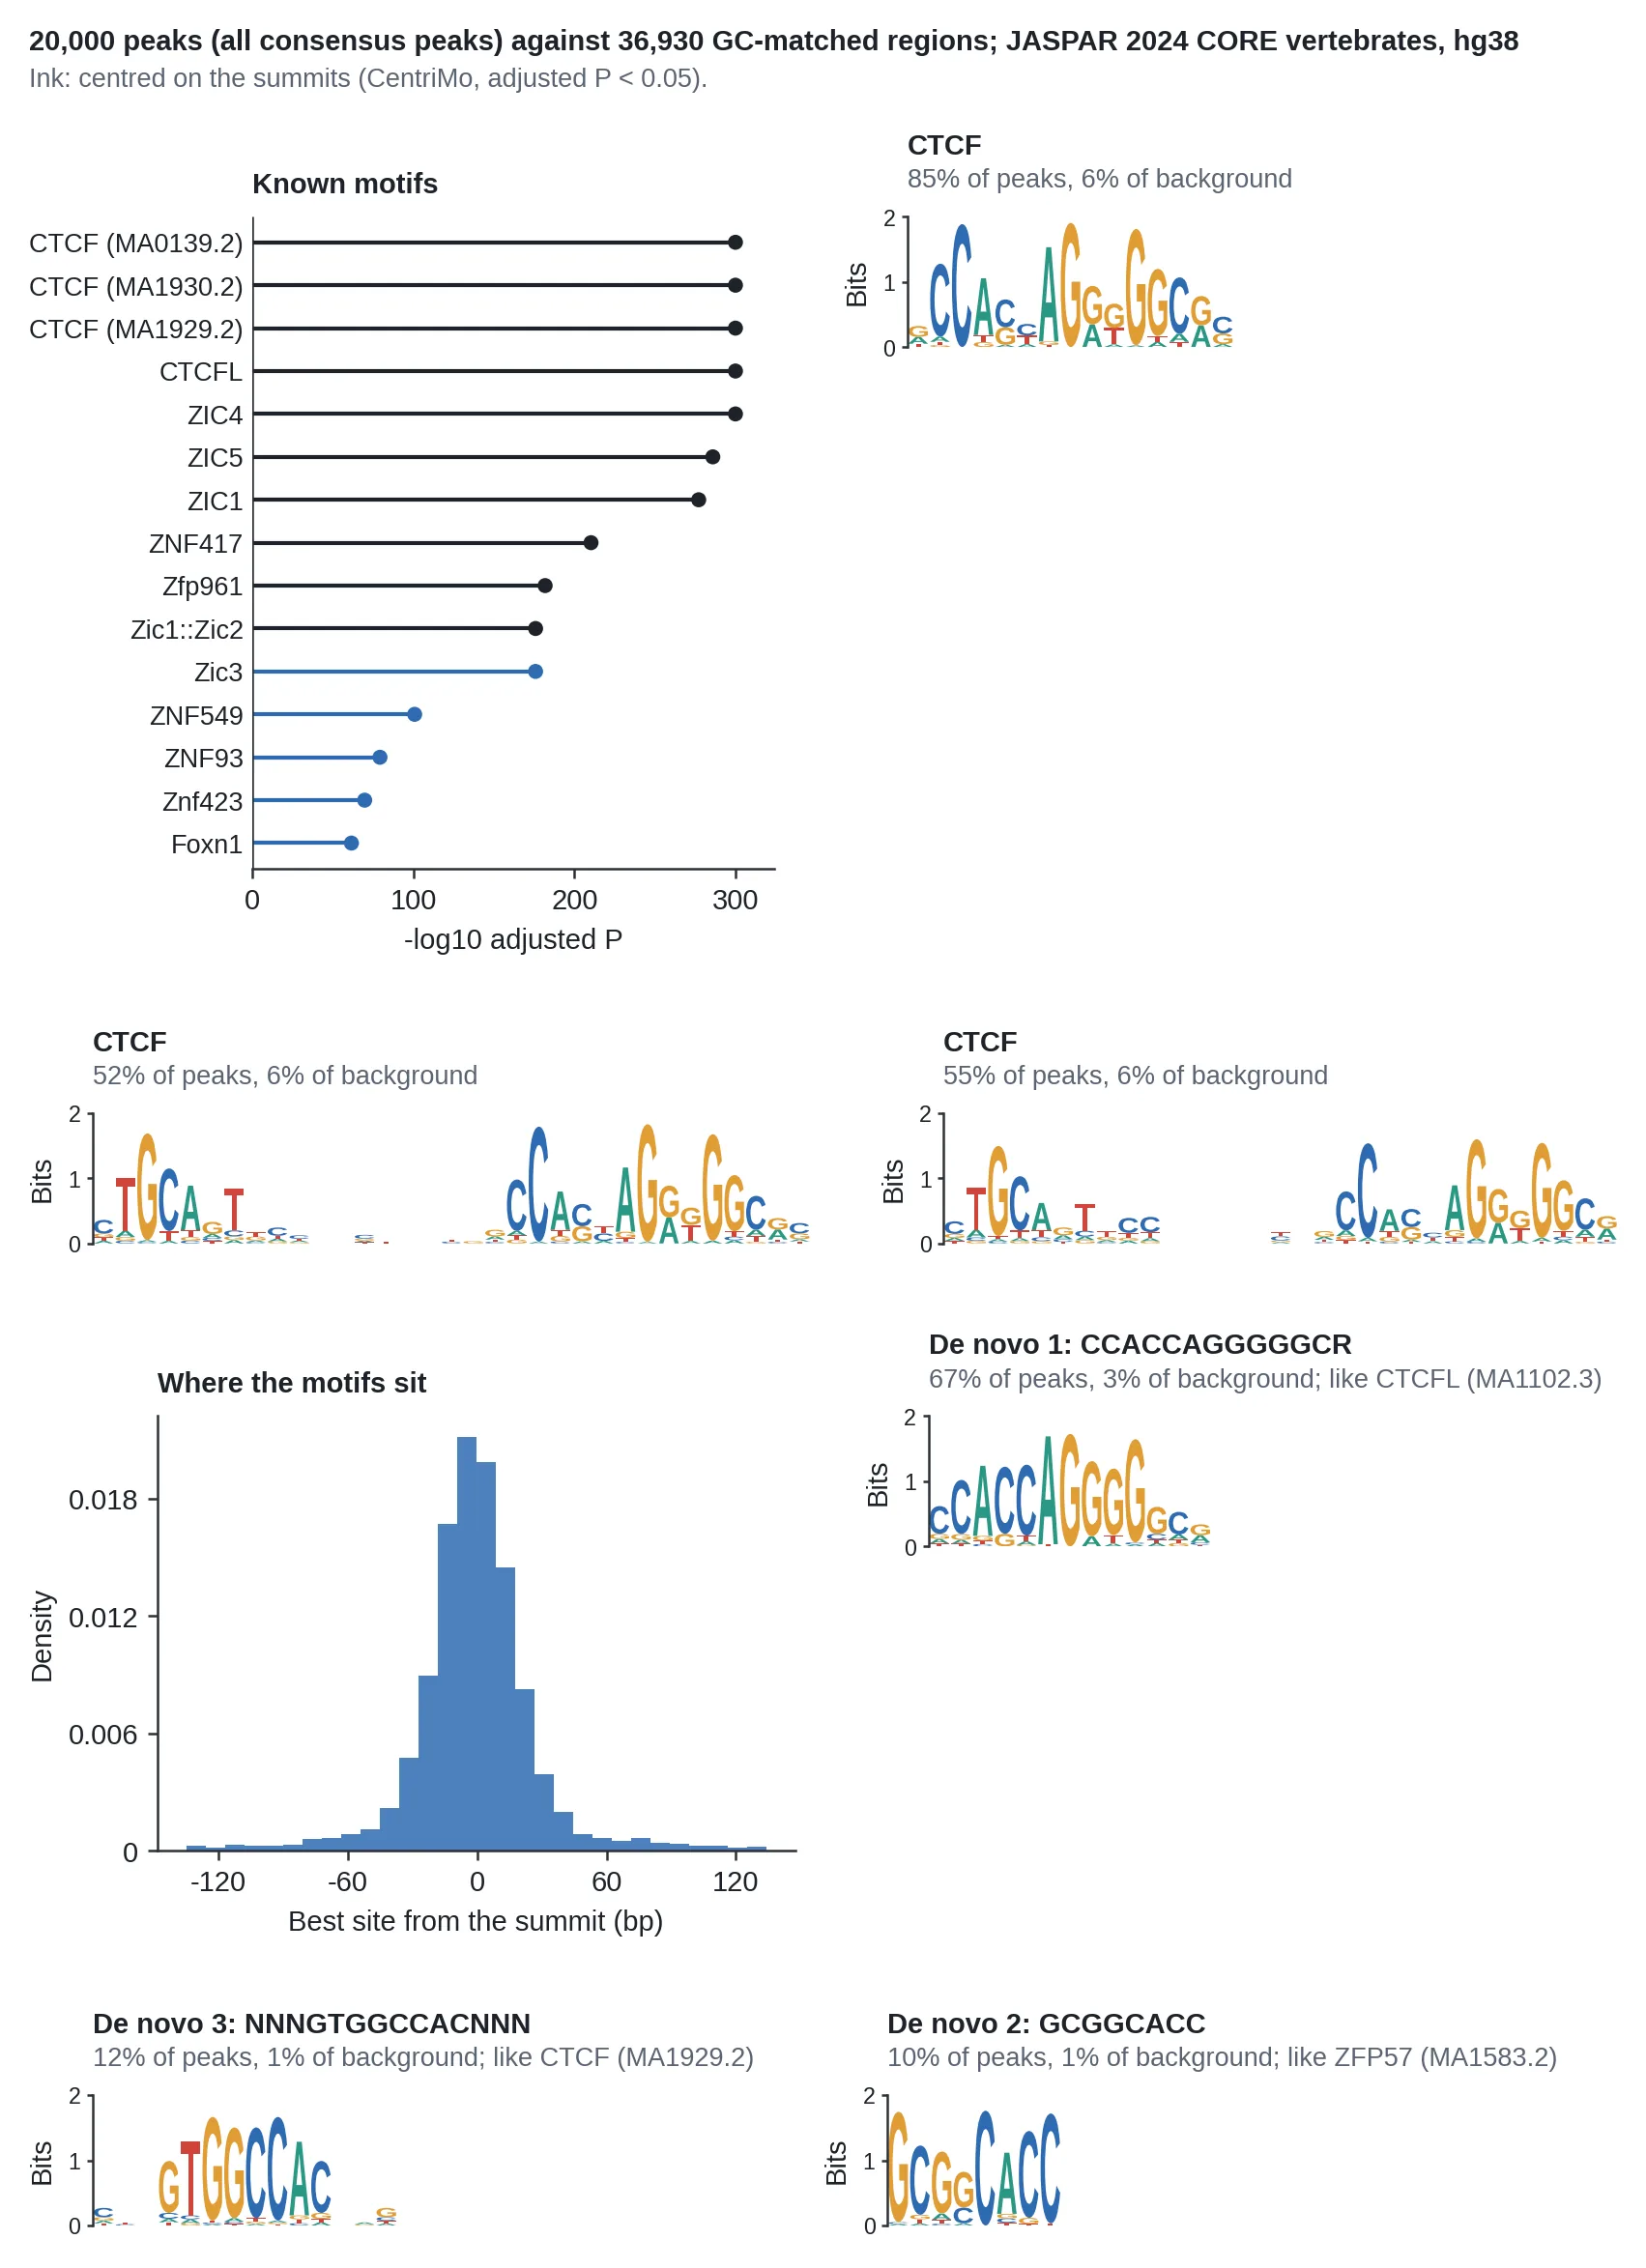
- Motif Enrichment looks for every JASPAR 2024 CORE motif in the summit ±100 bp of the strongest 20,000 peaks against GC-matched regions 3 and 6 kb away (HOMER's approach), then asks of the top motifs whether they sit at the summits (CentriMo): a directly bound factor's motif does, a partner's does not. Motifs are also found de novo, from the 8-mers most enriched at the summits, and named by the JASPAR matrix they resemble. Run it on the peaks a comparison gained to find the factor that brought the change.
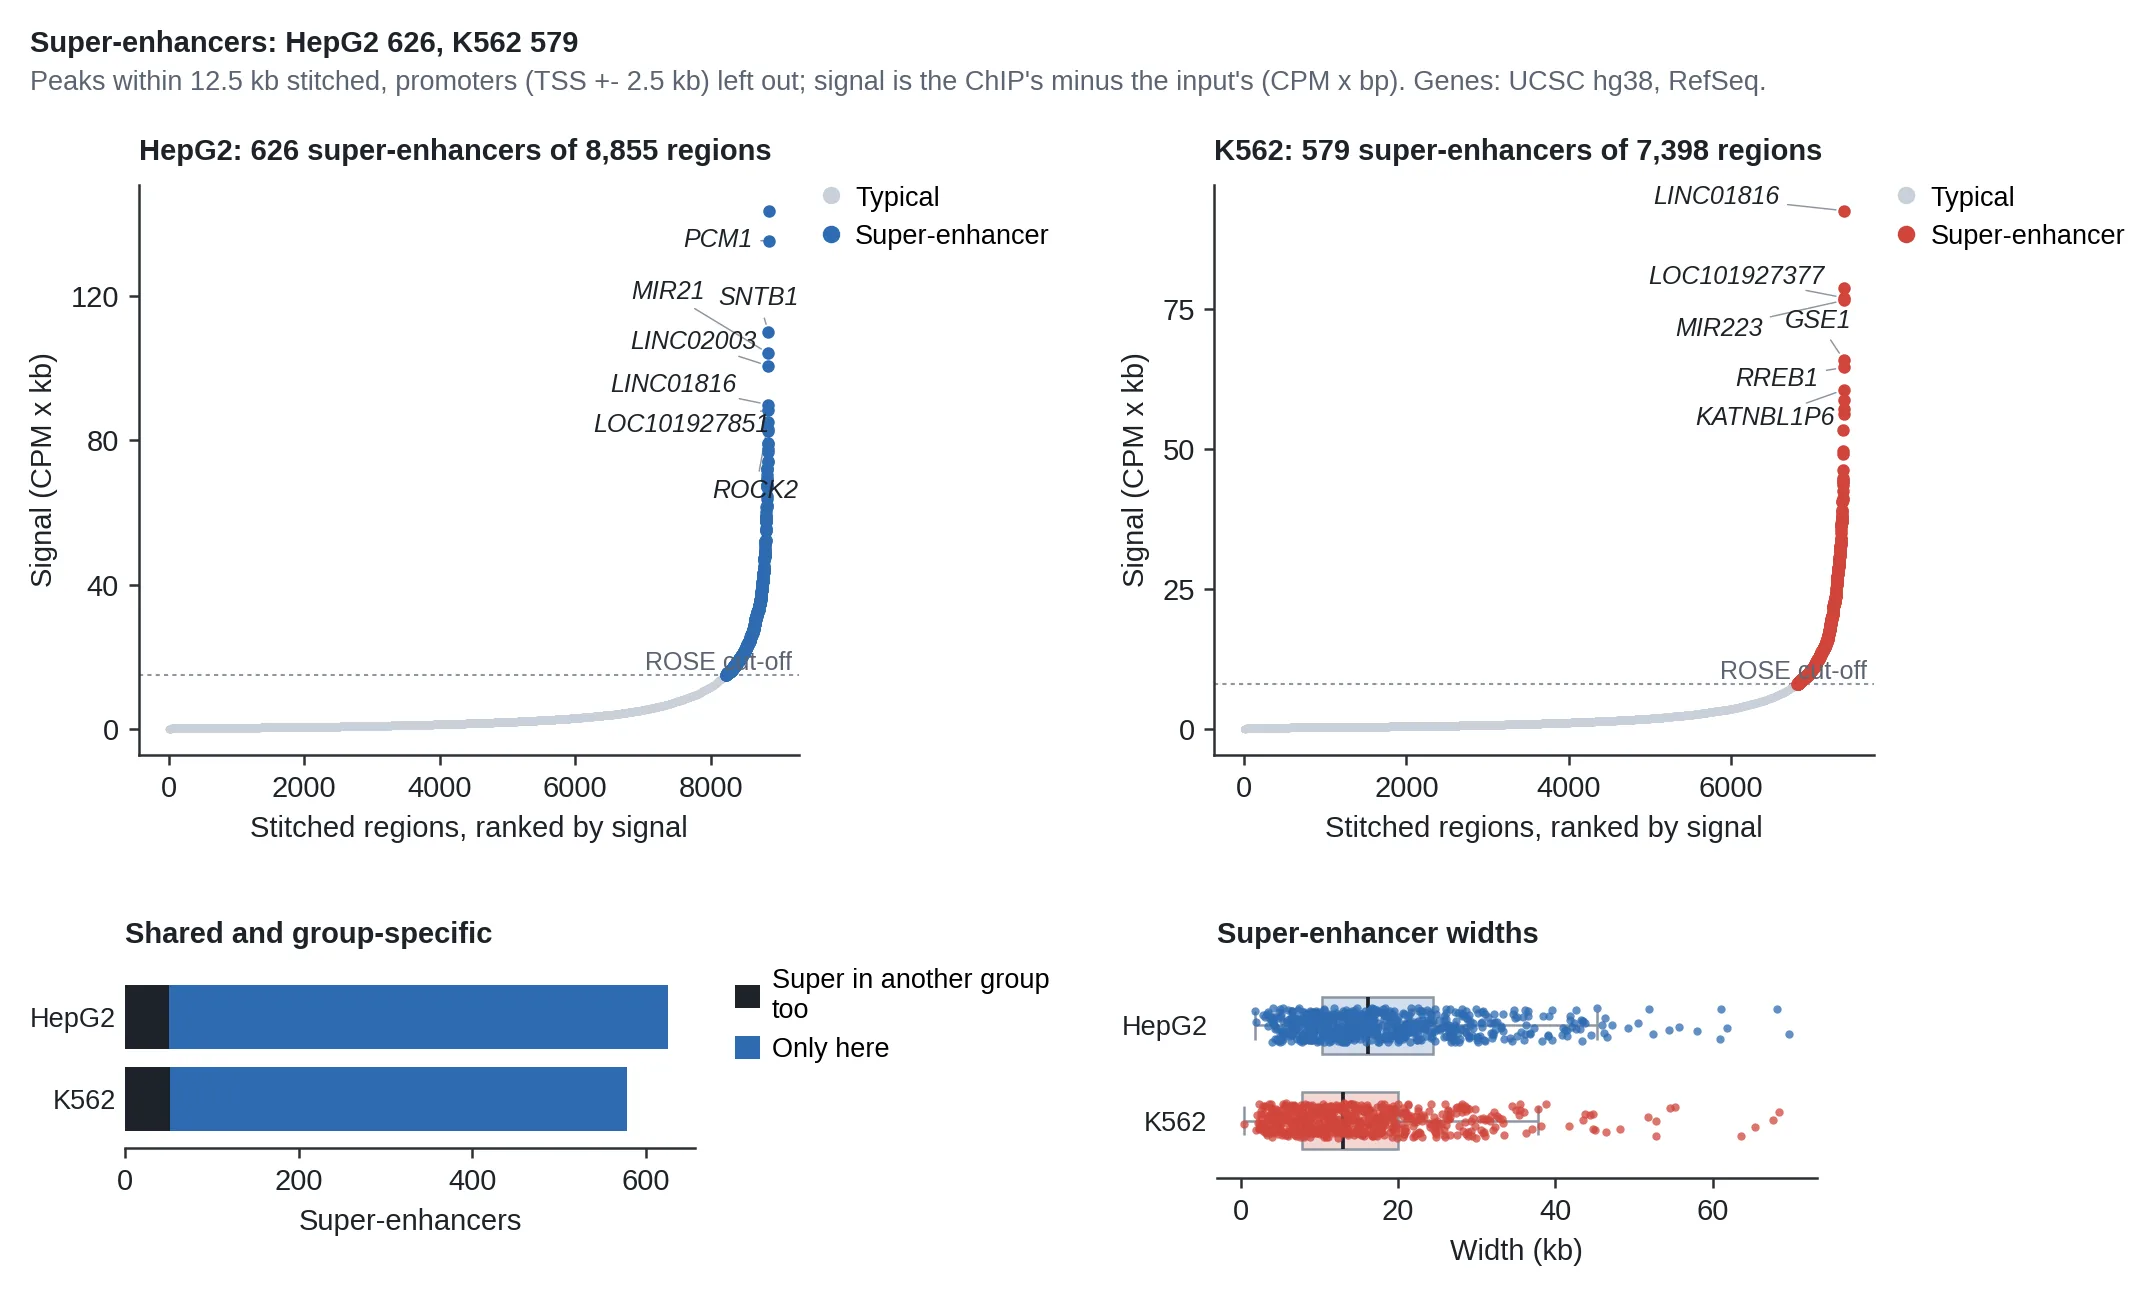
- Super-Enhancers follows ROSE (Whyte et al. 2013): for an enhancer mark (H3K27ac) or a co-activator (MED1, BRD4), each group's peaks away from promoters are stitched within 12.5 kb and ranked by their signal over input; the few far above the rest are the super-enhancers, at the genes of the cell's identity.
- Target Genes follows GREAT (McLean et al. 2010): each gene's regulatory domain reaches from 5 kb upstream of its start to its neighbours', up to 1 Mb, and a term is reported when its genes' domains hold more regions than their share of the genome predicts and more of its genes have a region than chance, both at an FDR under 0.05.
What the steps show on ENCODE data
The figures below come from the four sample datasets, run through every step.
Sample datasets
Browse Sample Datasets in a ChIP-seq session lists four ENCODE experiments (GRCh38), each in two conditions with replicates and their inputs. Each library keeps a random 11 million of its reads with MAPQ 30, duplicates included so its complexity can still be measured.
- CTCF: K562 against HepG2 (Bernstein lab): a factor with the strongest motif there is, at mostly the same sites in both lines. Use it for Library QC, Motif Enrichment and IDR.
- Glucocorticoid receptor: dexamethasone against untreated A549 cells (Reddy lab; McDowell et al. 2018), three replicates each: the drug creates the binding, a global gain, so the normalization decides what Differential Binding shows.
- H3K27ac: K562 against HepG2: active enhancers, for Super-Enhancers and Target Genes.
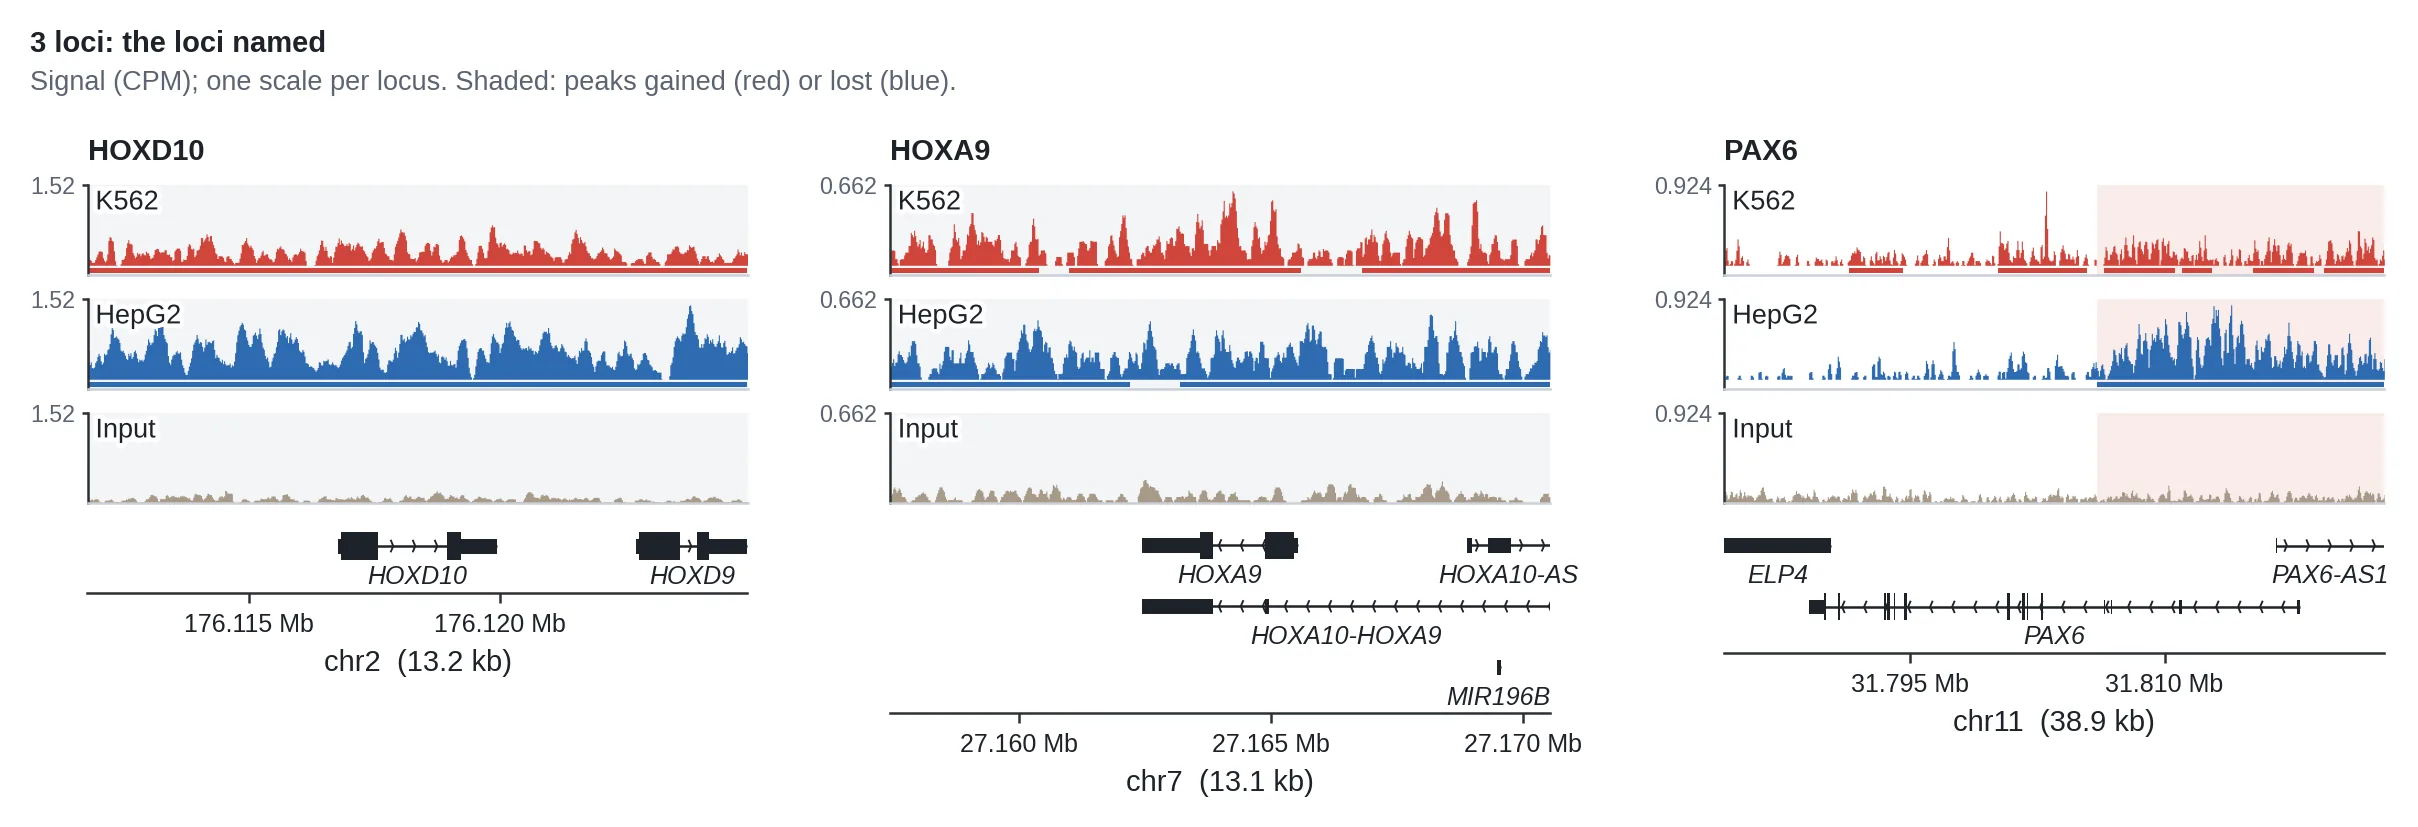
- H3K27me3: K562 against HepG2: Polycomb's broad domains over silent developmental genes, called as broad domains.
Sample metadata
As in bulk RNA-seq, the metadata editor asks for a condition per library. Inputs are not samples: they do not appear in it, and each keeps the ChIP libraries it belongs to.
Step reference
| Step | Stage | What it does | You get | Key inputs |
|---|---|---|---|---|
| Data Upload | Setup | Reads one file of aligned reads per library, leaves out reads under MAPQ 30 and those on chrM, a spike-in genome or unplaced contigs, removes the ENCODE blacklist and duplicates, measures each library's complexity, finds the fragment length from the strands' cross-correlation, pairs each ChIP with its input, calls every library's peaks against its input and counts the reads over the consensus. | Reads per library and where they went, and each library's strand cross-correlation. | BAM, tagAlign or fragment BED files (see What to upload). |
| Library QC | QC | Checks every library by ENCODE's standards: usable reads, NRF, PBC1, the duplicates, RSC, FRiP and the enrichment over input, with the fingerprints and the cross-correlation curves (NSC is reported, not judged). | One panel per measure with ENCODE's line dashed, the libraries to look at starred, and a table with the flags. | Group by. |
| Peak Calling | QC | Calls the peaks again with another threshold, as narrow peaks, broad domains (as SICER and epic2 call them) or MACS's --broad, with or without the input and the greylist, and takes DiffBind's consensus or the peaks the replicates agree on by IDR. | Peaks per library, their scores against the cut-off, their widths and how many libraries call each region. | Threshold, Mark, Consensus, Input, Inputs' hot spots, Group by. |
| Replicate Concordance (IDR) | QC | Compares every pair of replicates by IDR on loosely called peaks, and runs ENCODE's test with pseudo-replicates (the rescue and self-consistency ratios). | Each pair's peaks by their rank in either replicate, the counts ENCODE's test reads, its verdict, and an UpSet plot of which libraries call which peaks. | Group by, Pseudo-replicates. |
| Sample Similarity | QC | Correlates the ChIP libraries over the consensus peaks (log2 CPM) with a PCA, as DiffBind does, and every library, inputs included, over 10 kb bins across the genome, as deepTools does. | Clustered correlation and distance heatmaps, the PCA, and the genome-wide Spearman correlation. | Group by, Peaks. |
| Peak Annotation | Analysis | Places every peak among the genes in ChIPseeker's order (promoter, UTR, exon, intron, downstream, distal), beside 20,000 random positions of the same genome. | Where the consensus and each library's peaks lie, and their distance to the nearest TSS. | Genome build. |
| Signal at Genes | Analysis | Each library's or group's signal around every TSS, or across every gene body, as deepTools draws it. | Heatmaps with mean profiles, the genes clustered by their profiles. | Signal, View, Genes, Clusters, Show, Group by, Genome build. |
| Signal at Peaks | Analysis | The signal at the consensus peaks, the peaks Differential Binding called, or the super-enhancers. | Heatmaps with a mean profile per cluster, and each peak's signal as a table. | Signal, Peaks, Clusters, Show, Group by. |
| Motif Enrichment | Analysis | Tests the summits for JASPAR motifs against GC-matched DNA nearby, checks whether the top motifs sit at the summits, and finds motifs de novo, each named by the JASPAR matrix it resembles. | The most enriched motifs, logos, where the motifs sit against the summits, and the motifs found de novo. | Peaks (all, gained or lost), Genome build; motifs by name in your own words. |
| Differential Binding | Analysis | Tests every consensus peak for gained or lost binding between two groups with DESeq2, as DiffBind 3 does, normalized by library size, reads in peaks, background bins or spike-in, the input subtracted if asked. | A volcano, an MA plot, where the changes lie, the size factors of every normalization, and every peak's change (a global shift moves its median). | Parameter to compare, two values, Normalization, Subtract the input, Minimum fold change. |
| Super-Enhancers | Analysis | Finds super-enhancers per group as ROSE does: peaks away from promoters stitched within 12.5 kb, ranked by signal over input, the hockey stick's elbow as the cut-off. | Each group's ranked regions with its super-enhancers named by gene, those shared and those of one group only, and their widths. | Group by, Stitch, Leave out promoters, Genome build. |
| Target Genes (GREAT) | Analysis | Finds what the regions regulate as GREAT does: every gene's regulatory domain, a binomial test over regions and a hypergeometric test over genes for every term of a gene-set library. | The terms both tests find, how many genes each region is given and how far from them. | Regions (all, gained, lost or super-enhancers), Gene sets, Genome build. |
| Genome Tracks | Analysis | Shows the signal at the genes or regions you name, or the strongest changes, as genome browser tracks. | One track per library or group, the inputs, the peaks, the changes shaded and the genes beneath. | Signal, Show, Group by, Genome build; genes or regions in your own words. |
On the four ENCODE sample datasets, every step runs (tests/pipelines, TestChipSeqCtcf, TestChipSeqGr, TestChipSeqH3k27ac, TestChipSeqH3k27me3). A library's NRF, PBC1 and PBC2 match ENCODE's own report for the same file to three decimals (CTCF K562 replicate 1: 0.819, 0.821, 5.632), and RSC is within about 15% of it. CTCF: its motif is ranked first, in 85% of the summits; and Target Genes on the sites HepG2 has and K562 lacks finds the type I interferon genes (IFNA1 to IFNA21, IFNB1, IFNW1), which K562 lost with its 9p21 deletion. The glucocorticoid receptor: the steroid receptors' motif (NR3C1's and its relatives', in 29–31% of the peaks against 1% of GC-matched DNA) comes first, then AP-1's, the partner it binds enhancers with; 4,761 peaks gained with dexamethasone and none lost; and the treated cells' super-enhancers include FKBP5, ZBTB16 and ERRFI1, three of the receptor's classic targets. H3K27ac: the super-enhancers sit at each line's identity genes. H3K27me3: the replicates' domains agree on 10,862 by IDR, a median 15.4 kb long, over the HOX clusters, PAX6 and GATA4 in both lines, and over GATA1 in HepG2 only (3.6 times the input, against 0.39 in K562, where GATA1 is active).