
Flow cytometry
Gate FCS files on a screen made for it, or bring the gates of your FlowJo workspace with them, and get every population's numbers in every well, compared between groups of wells. Gating is not a step: it is the analysis's main view, and the steps count what its gates hold.
What you can upload
- FCS files, one per well or tube, loose or in an archive (zip, tar, tar.gz, tar.bz2 or tar.xz, an archive inside another up to three deep). A file is taken as FCS by what it holds, whatever it is called: FCS 2.0, 3.0 and 3.1, and 3.2 when its channels share one data type. The standard's scaling is applied: log-amplified values back to linear ($PnE), the gain divided out ($PnG) and time by $TIMESTEP.
- A FlowJo 10 workspace (.wsp) for them, if you have one. Its gates, axes and compensation come with it, below.
Anything else in an upload is skipped; an upload with no FCS file is refused. Each file is a row of the data, named by its file name. Its plate position comes from $WELLID, or from a well at the start of its name (A01, B4). There is no sample dialog: the steps group the wells from their names and positions.
Channels, compensation and axes
Gates name a channel as the file does ($PnN), and the screen labels it with its marker ($PnS) when it has one, such as CD56 : RB780. Files from spectral cytometers (Sony ID7000, Cytek Aurora, BD FACSDiscover) come unmixed already. A conventional cytometer's file carries its spillover matrix ($SPILLOVER), and a workspace may give each sample its own; a well's matrix is the workspace's when one came, else the file's. Gates from a workspace that FlowJo drew on compensated channels are tested on compensated values, as in FlowJo, and the Statistics Table's medians, means and CVs are compensated wherever a well has a matrix. The gating screen shows the values as recorded: there is no compensation switch on it yet, so gates you draw there are on uncompensated values.
Without a workspace, scatter channels are linear from 0 to their range, time linear over the data, and every other channel on FlowJo's biex axis (width −10, 4.42 positive decades). Click an axis to change it: Linear, Log, Biex or Arcsinh, or FlowJo's default. Keep saves it for every well.
A FlowJo workspace
Each sample of the workspace finds its file by name, by the $FIL the file keeps inside it, or by a looser name (letters and digits only, with a prefix your upload added allowed), so files renamed on their way still find their gates. From the workspace come:
- The gates and population names, as one tree. A gate most wells share becomes the shared gate; a well whose gate FlowJo moved keeps its own, marked changed on this well.
- Each channel's axis, the setting most wells share, a well that differs keeping its own.
- Each sample's compensation matrix.
Rectangles, ranges, quadrants (FlowJo writes them as rectangles), polygons and ellipses are read. Boolean gates, gates on a derived (ratio) parameter, and the populations under them are left out, as are axes of other kinds (hyperlog) and the workspace's tables, layouts and groups. Only the first of several workspaces is used, and FlowJo 11's .flowjo files are not read.
The gating screen
When the upload is done, gating is the analysis's main view; the Gating button in the toolbar switches between it and the steps. Down the left runs the chosen well's chain of plots, one per gate from all events to the end of the branch. The chosen gate's plot is large beside it, and to the right is that gate on every well, laid out as the plate, with the result. Every gate applies to every well.
- Tools
- Rectangle, Polygon, Lasso (kept as a polygon of up to 64 corners), Ellipse, Quadrant (four populations named from the axes' markers, such as CD16+ CD56−) and Range, drawn on a histogram (choose Count for the y axis).
- The gate card
- A gate's % of parent, cells, % of all events and medians. Edits go to all wells or this well; a well's own gate says changed on this well, and Use the shared gate takes it back. Copy puts every well's count and % on the clipboard as a table for a spreadsheet; Redraw and Remove (the gate alone, or with the gates inside it) do as they say.
- Plots
- Pseudocolour, dots, contour, density or zebra, in three dot sizes. Backgating colours the chosen population's cells in the plots above it in the chain.
- The Gates menu
- Every population with its % of parent and count. Use gates from another analysis copies a strategy, matching channels by their marker, then by marker and measure, then by name; a gate on a channel this analysis lacks is left out with everything inside it. Download for FlowJo (.wsp) and History (the last 300 changes) are there too, and Undo and Redo in the toolbar.
Every change is kept, and History lists the last 300 to go back to. When two people edit at once, the one who saves second sees the other's gates: Someone changed the gates in the meantime. A strategy holds up to 300 populations.
Gates count events as FlowJo does: a rectangle includes its lower edge and not its upper one, a polygon holds what the even-odd rule says, an ellipse is tested on FlowJo's 256-step display grid, and an event past the end of an axis counts at that end.
Download for FlowJo
Download for FlowJo (.wsp) writes a FlowJo 10 workspace: every well under All Samples with the shared gates, each well's compensation, axes and keywords, a gate changed on one well as that sample's own, and baSeq's count of each population. Wells are named by their $FIL when every well has a different one, else by the uploaded file name. FlowJo looks for the FCS files beside the .wsp, unless the workspace you uploaded said where they are. Tables, layouts and Boolean gates are not written.
Statistics
- Count, % of parent, % of grandparent, % of all events
- As FlowJo defines them; a population without a grandparent takes all events for it.
- Median, Mean, SD, CV
- On the channel's values, compensated where the well has a matrix. CV is 100 × SD / mean, the SD with n − 1.
- Geometric mean
- As FlowJo takes it: the mean of the events' positions on the channel's axis, mapped back to a value.
- Robust CV
- 100 × half the distance from the 15.87th to the 84.13th percentile, over the median.
baSeq's values are exact. FlowJo counts some on binned events, so the last digits can differ, and a gate whose edge runs through a dense cloud can hold a few events more or fewer in FlowJo.
Comparing groups of wells
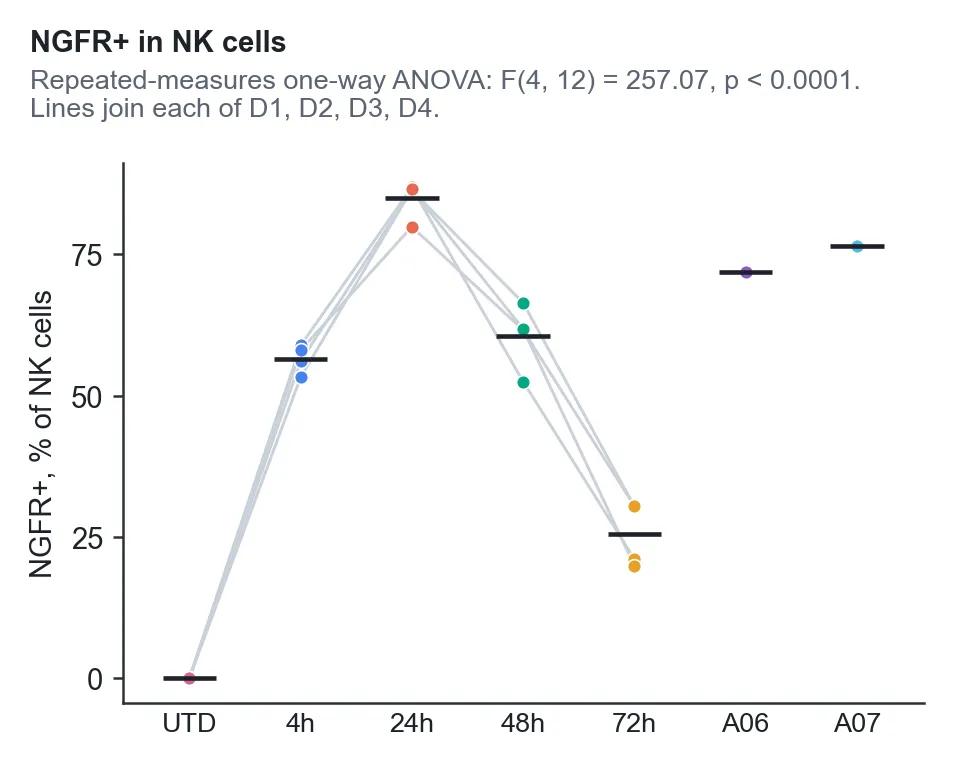
Population Statistics groups the wells from their names and plate positions: the plate's columns by the word their wells share (24h), its rows likewise (D3), or, off a plate, the parts of the names that differ. By default it compares the plate's columns, paired by its rows, so each donor is compared with itself. Paired, it runs a repeated-measures one-way ANOVA over the donors measured in every group, then a paired t-test between each two groups; unpaired, Welch's one-way ANOVA, then Welch's t-tests. The pairs' p-values are adjusted by Holm's method. A group of one well is shown but not tested. Without a choice, the population is the last gate of the strategy's first branch, and the measure its % of parent.
Sample dataset
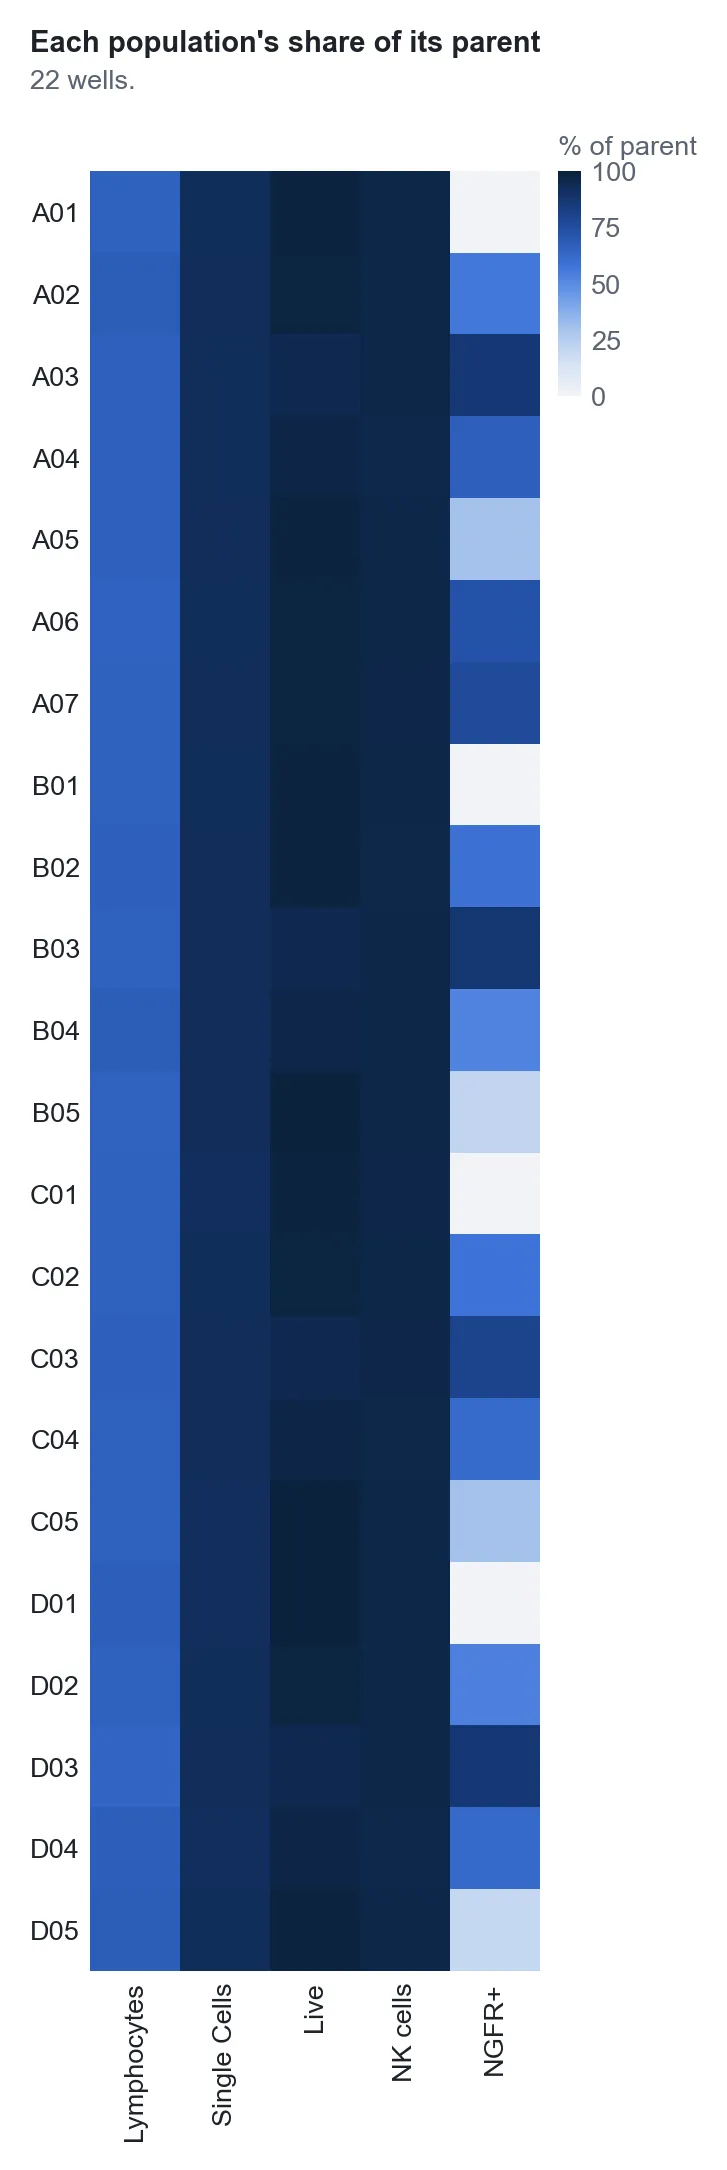
Browse Sample Datasets in a flow cytometry session lists a simulated plate: every event is made up, nothing comes from a real experiment. Its 22 wells are shaped like an NK-cell transduction experiment on a spectral cytometer, already unmixed: four donors (rows A to D), untransduced and 4, 24, 48 and 72 hours after transduction (columns 1 to 5), and two extra wells. The channels are as a Sony ID7000 writes them (CD16 BV785, CD56 RB780, NGFR APC as the transduction marker, and a Zombie-NIR live/dead stain), and it comes with the five gates such a lab draws: Lymphocytes, Single Cells, Live, NK cells and NGFR+.
Step reference
| Step | Stage | What it does | You get | Key inputs |
|---|---|---|---|---|
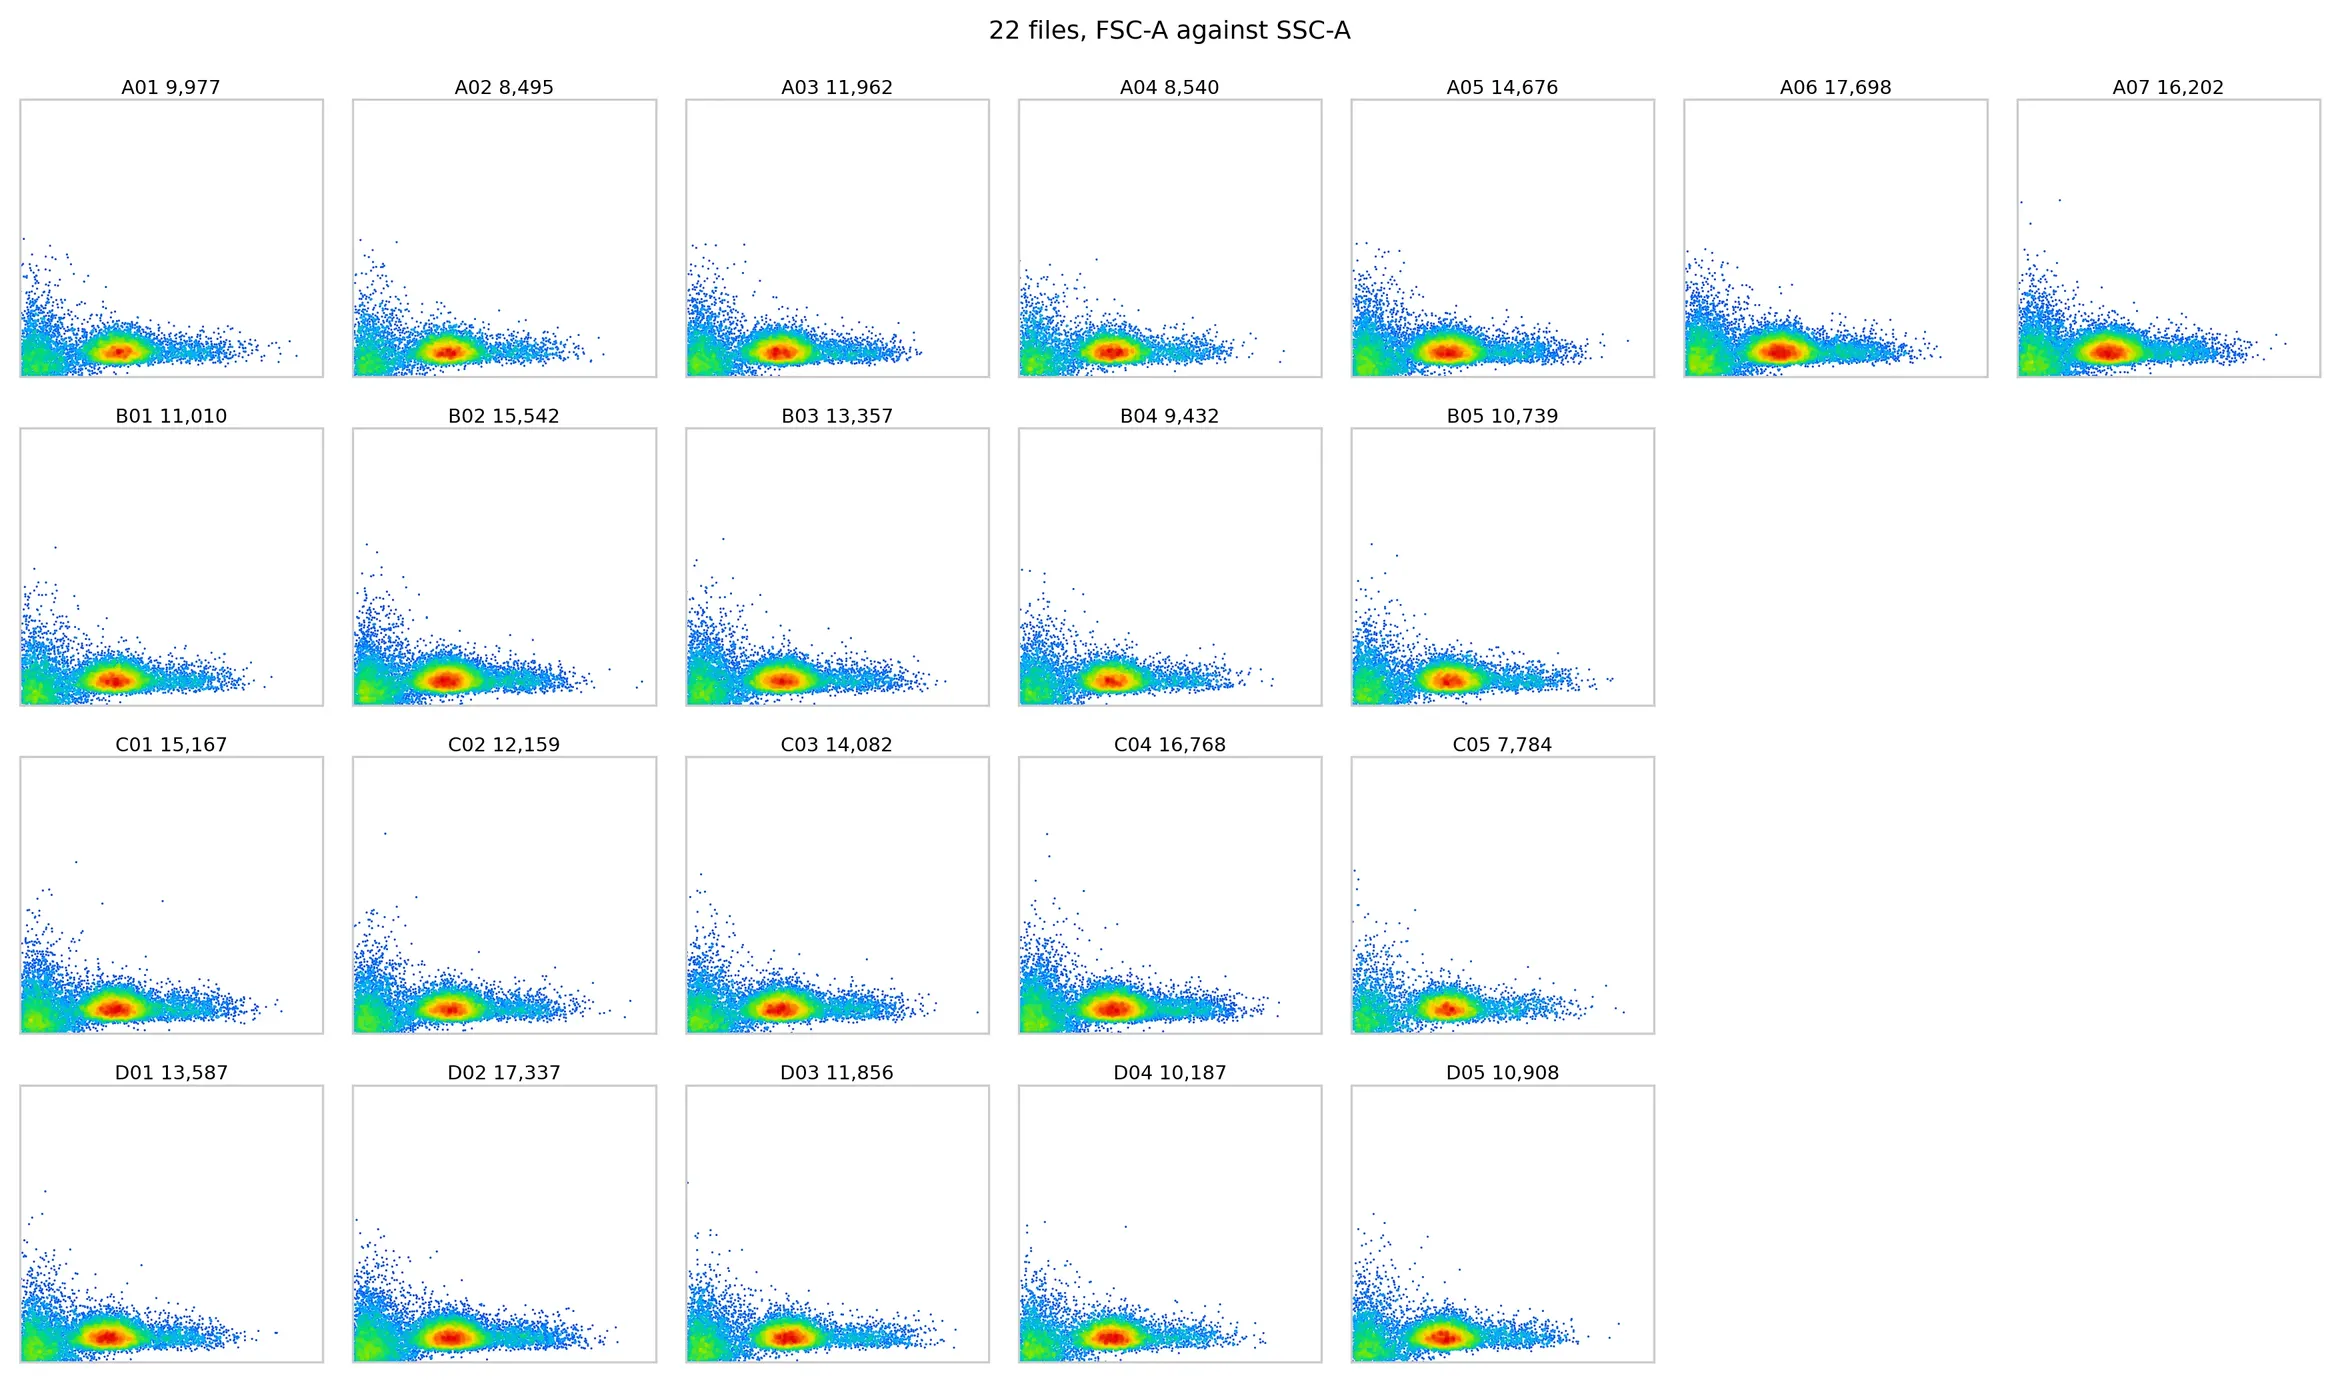
| Data Upload | Setup | Reads your FCS files and your FlowJo workspace, keeps every event beside the data, and draws each well's FSC-A against SSC-A as the plate. | The plate figure, and a table of each file's well and events. | FCS files, loose or in a zip; a FlowJo 10 workspace (.wsp) for them, if you have one; or the sample dataset. |
| Statistics Table | Analysis | Every population's numbers in every well as one table, as FlowJo's table. | A table of the wells by population and statistic, and a heat map of each population's share of its parent. | Populations (none ticked: all); Statistics (% of parent); Channels (none ticked: the markers). |
| Population Statistics | Analysis | Compares one population between groups of wells, such as the time points of each donor: each well's share or a channel's median, mean or CV, the groups' means and the tests between them. | Each well's value by group, the wells of one donor joined; the test in the figure's note; tables of the wells and of each two groups' test. | Population (the last gate); Measure (% of parent); Channel; Compare (the plate's columns); Pair by (its rows). |
Gating follows Gating-ML 2.0: on its compliance suite (FlowKit's copy) all 51 gates agree with the suite's answers on every one of 13,367 events. FlowJo's biex axis is rebuilt to within 0.0005% of FlowJo 10's own. On FlowKit's public FlowJo workspaces, the ellipse, diamond and quadrant examples give FlowJo's counts exactly, and on its 8-colour intracellular staining workspace every population is within 0.3 points of FlowJo's share of its parent; FlowKit, which counts events as baSeq does, agrees with baSeq, and the rest is FlowJo's binning. The workspace baSeq writes reads back with every gate's count in every well, and FlowKit counts its rectangles and polygons exactly. The repeated-measures ANOVA equals statsmodels' (F to 6 places, p to 10), and the paired and Welch t-tests equal SciPy's.