
Small RNA-seq
Which miRNAs differ between conditions. Upload the count tables your pipeline wrote, or count FASTQ files on baSeq: the miRNAs become the data, the other small RNAs are kept apart, each library is checked for depth and hemolysis, and DESeq2's model is fitted on the miRNAs alone.
What you can upload
- Count tables from miRDeep2, mirtop, the GDC's miRNA quantification, exceRpt, miRge3 or sRNAbench, or any table of counts with a miRNA per row and a sample per column (or the other way round): comma-, semicolon-, tab- or space-separated, gzipped, or the first sheet of an Excel file. featureCounts' Chr, Start, End, Strand and Length columns are not taken for samples.
- miRNA names as miRBase writes them (hsa-miR-21-5p, and the older miR-21 and miR-21*), as MirGeneDB writes them, or miRBase's accessions (MIMAT…, MI…). A name with an accession or its precursor beside it (after |, : or /) is read as the name. In a table that writes its names in lower case, hsa-mir-451a is read as the mature miRNA rather than its hairpin.
- FASTQ files, counted on baSeq: FASTQ upload tells the kit from the reads, trims and aligns them, counts each miRNA and opens the counts here. Human and mouse.
Normalized columns (RPM, CPM or TPM as a word of the name, and RPKM, FPKM, log or norm) are left out with a note, and the endings aligners add to sample names (.bam, .sorted, Aligned.sortedByCoord.out) come off. Total and summary rows are dropped, isomiR rows are added up, and a miRNA listed once per precursor is counted once. A table of differential expression results, of normalized values only, or of values that sum to a million or look like logs is refused, because DESeq2 needs counts; reads a tool shared between two miRNAs as fractions are rounded to whole reads.
miRNAs and the other small RNAs
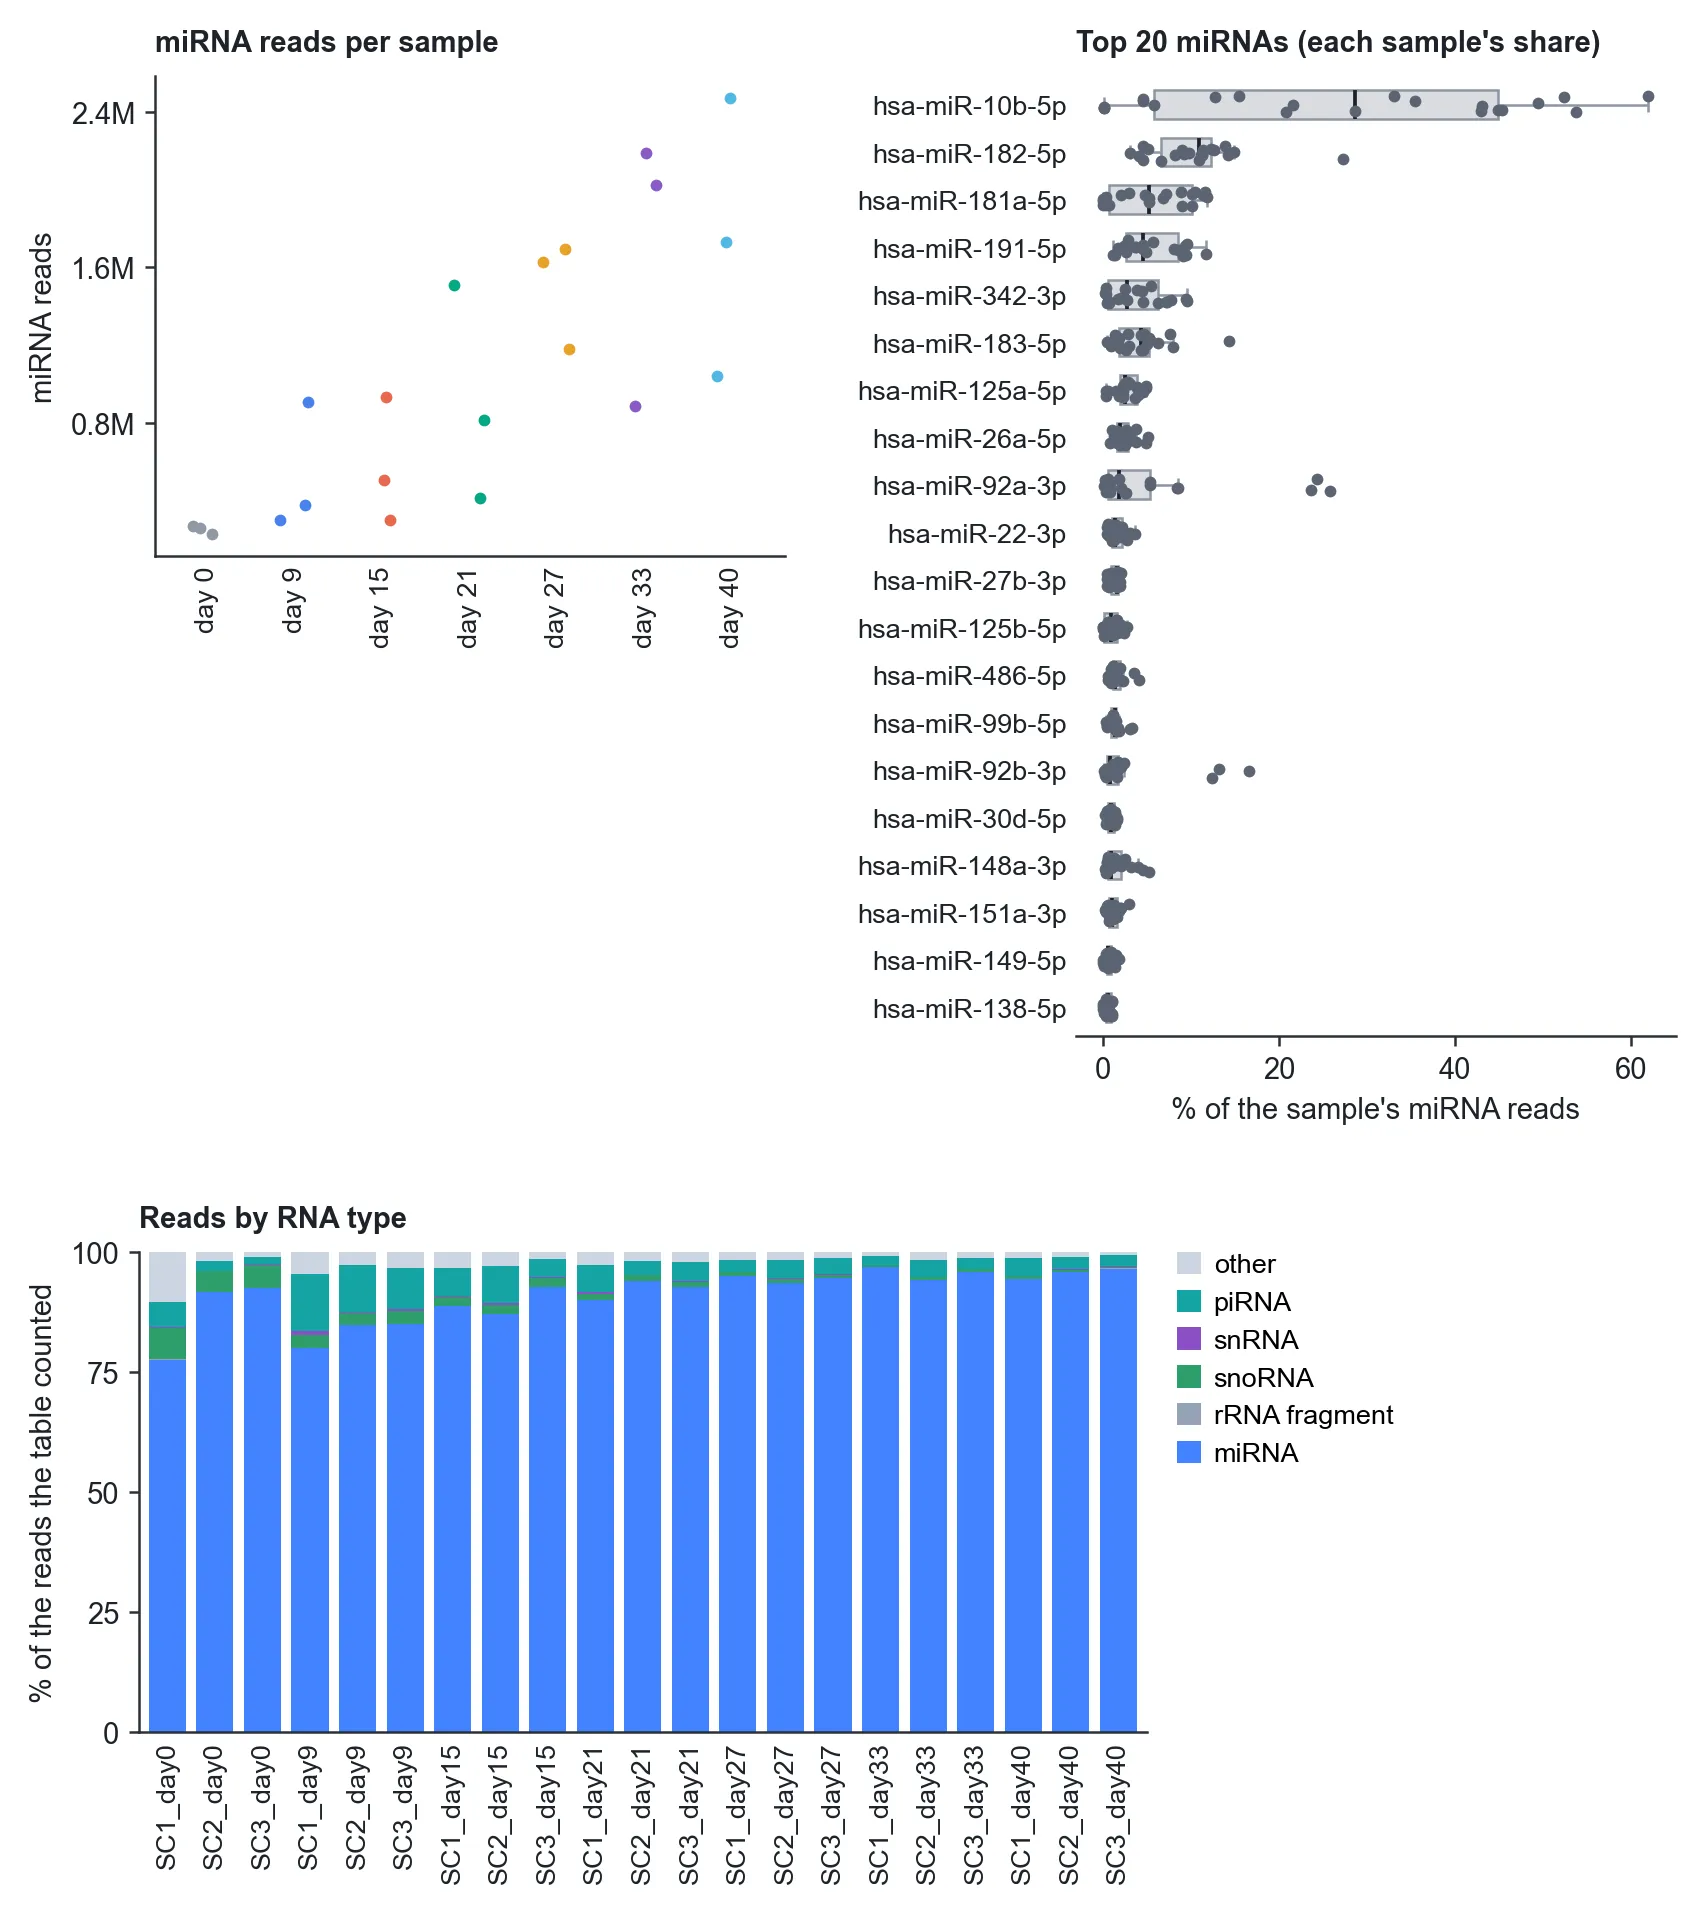
The mature miRNAs are the data. Precursor (hairpin) rows beside them are kept apart; a table of precursors only is counted as precursors, with a warning. Everything else a table counts is kept apart by its name: spike-ins (UniSp, ERCC, and the worm and plant miRNAs used as spike-ins), other species' miRNAs, tRNA and rRNA fragments, snoRNAs, snRNAs, Y and vault RNAs, piRNAs and other small RNAs. None of them enters the model, so DESeq2's size factors come from the miRNAs alone, and the Initial Plot shows each sample's reads by type. The organism comes from the names' prefix: hsa human, mmu mouse, bta cattle, ssa salmon, dre zebrafish. Small RNA-seq is for animals; bacteria make no miRNAs.
The recommended order
- Upload your count tables: the Initial Plot is a first look
- Library Quality
- Filter Low miRNA Counts
- Dispersion and Parameters (this fits the DESeq2 model)
- Sample to Sample Similarity and Principal Component Analysis
- Then any analysis step: Differential miRNA Expression, Time Course, Heatmap, Boxplots, Volcano Plot, MA Plot or a Custom plot
These are the bulk RNA-seq steps, worded for miRNAs, and comparisons are chosen the same way. The steps that need genes are left out: GO terms, GSEA, STRING and pathway maps. Only Heatmap, Boxplots and Custom plot ask you to describe something; the other steps run as they are.
Library Quality
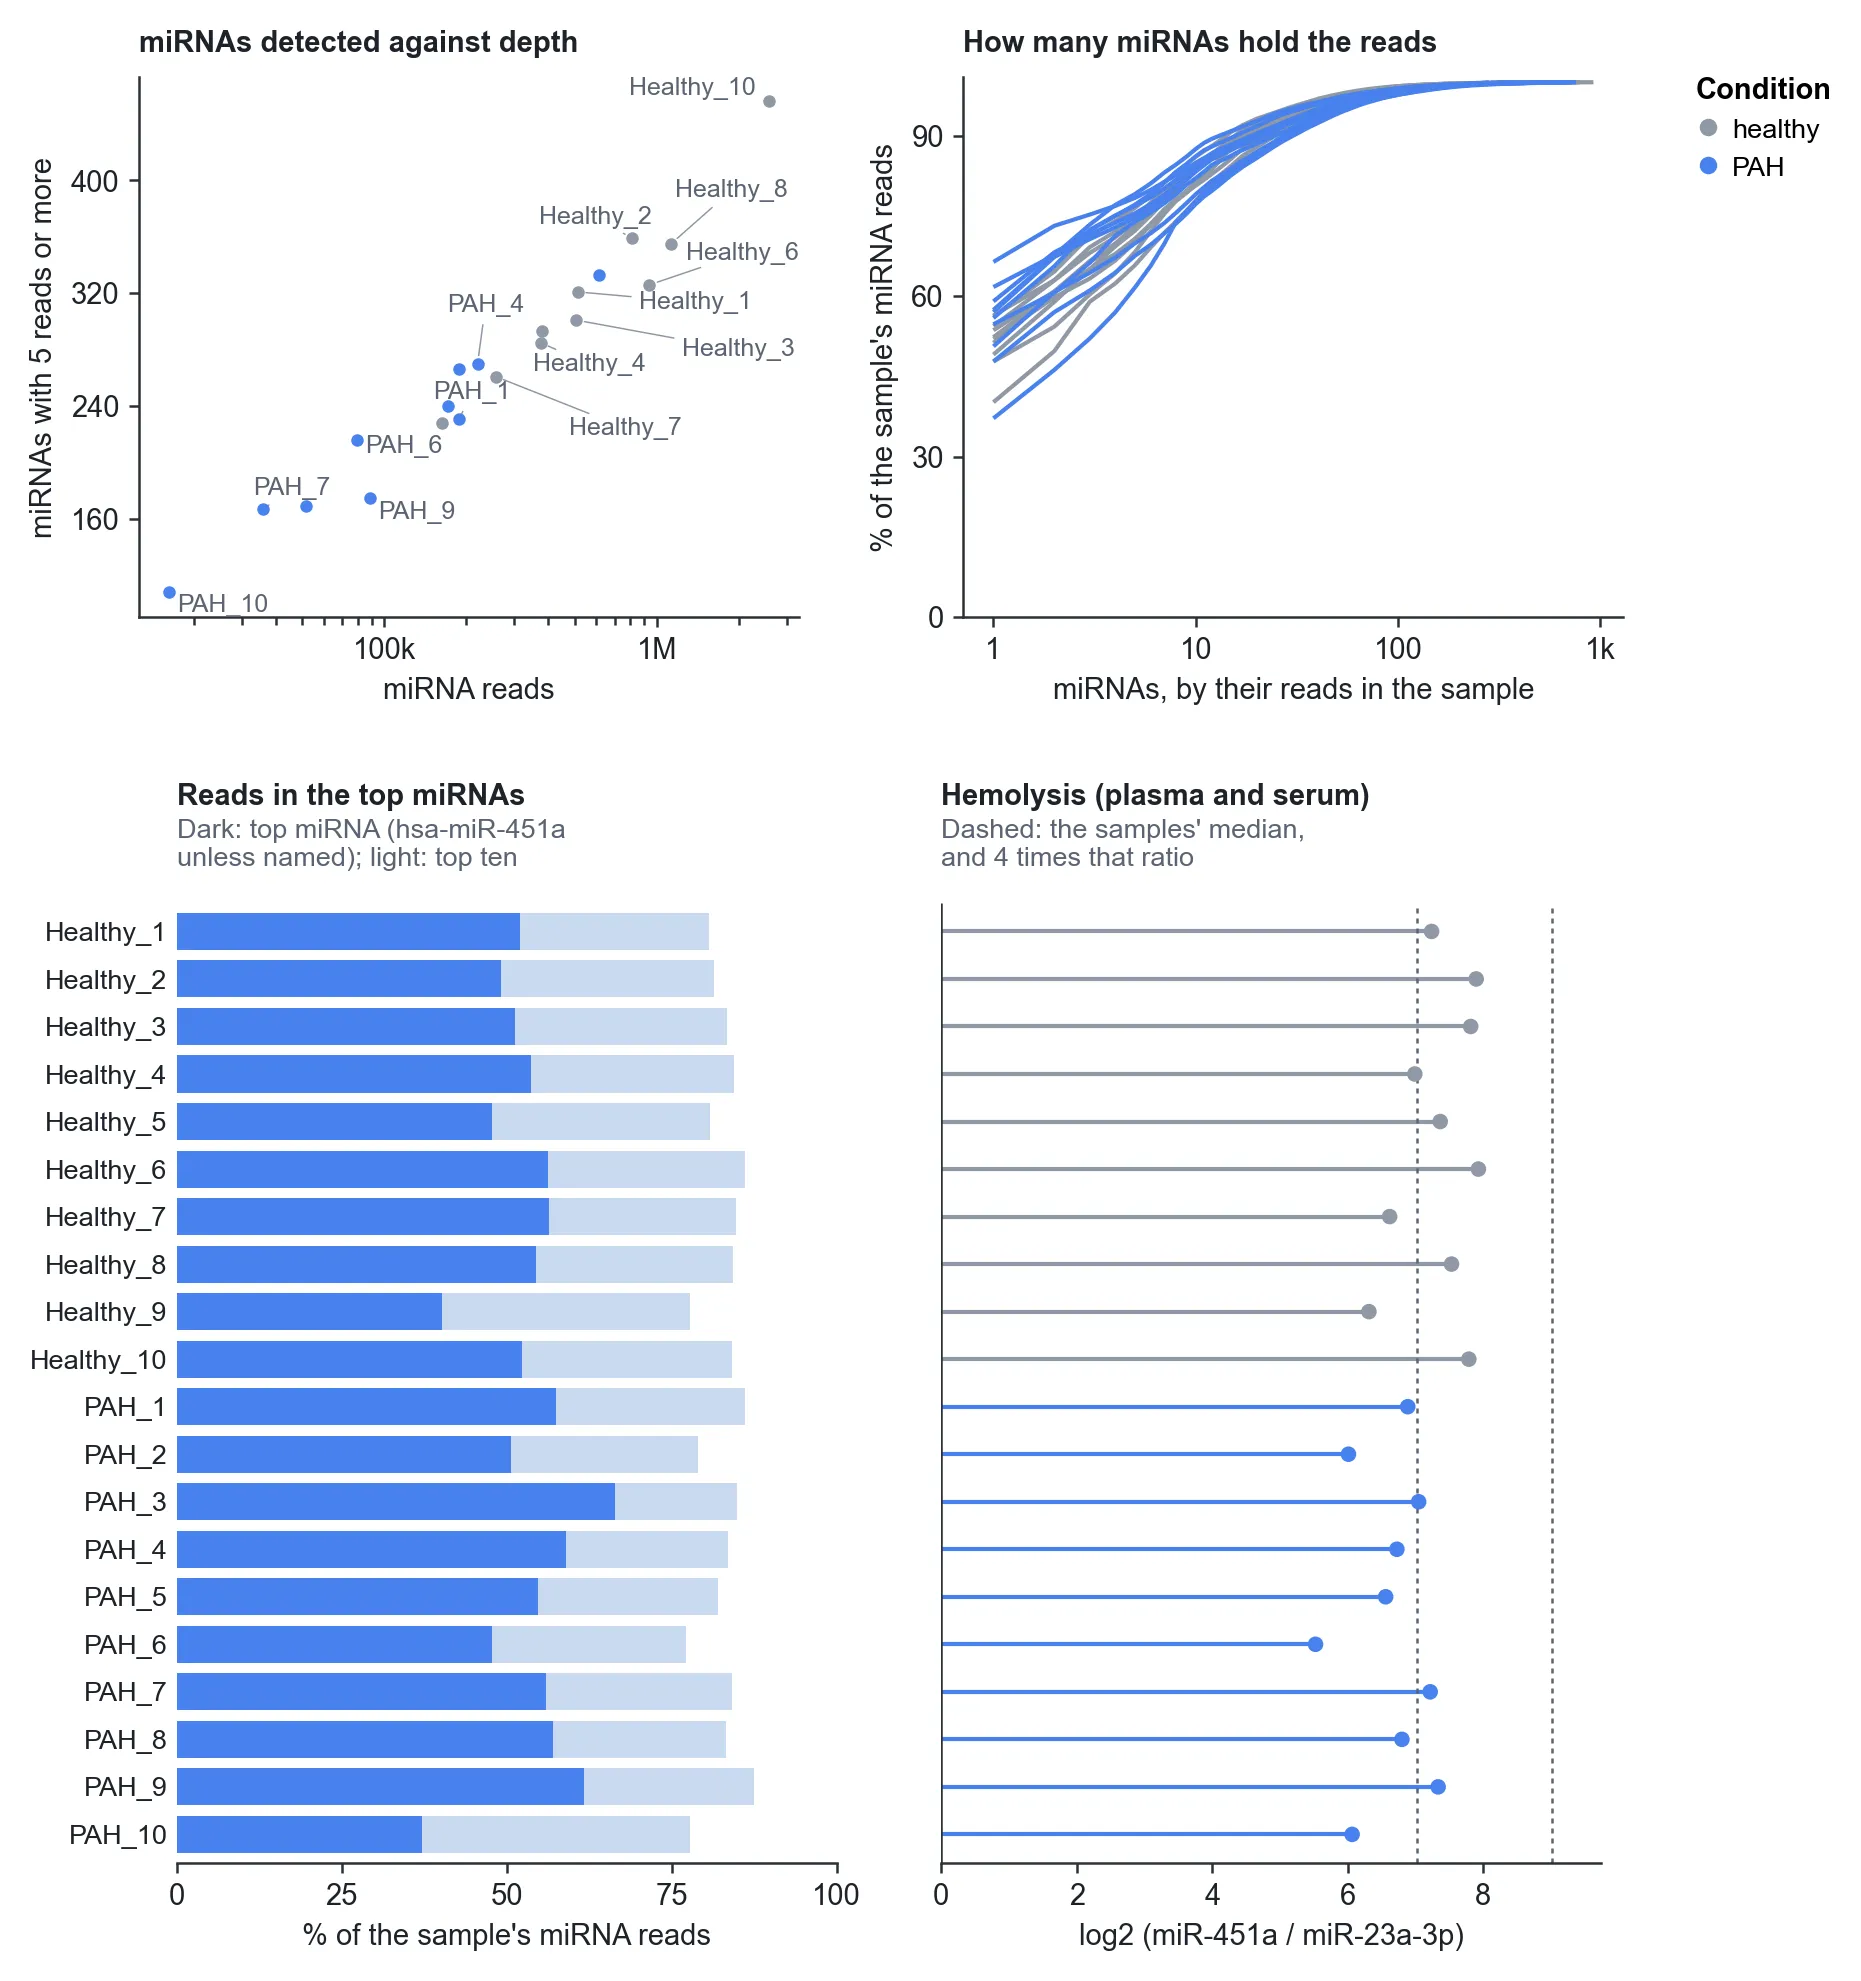
- miRNAs detected against depth
- Each library's miRNA reads against its miRNAs with 5 reads or more (or the count you choose). A library far below the others for its depth was mostly something else, such as degraded RNA or adapter dimers; the summary names any sample with under half the median miRNAs.
- How many miRNAs hold the reads
- Each sample's miRNAs ranked by their reads, against the share of its miRNA reads they hold. In plasma a handful hold most of them.
- Reads in the top miRNAs
- The top miRNA's share and the top ten's. A sample whose top miRNA differs from the others' is named on its row.
- Hemolysis
- For plasma and serum: log2 of miR-451a, which red cells hold, against miR-23a-3p, which hemolysis leaves as it is. A sample 4 times (log2 2) or more above the samples' median is marked check, when there are 3 samples or more. The ratio is judged against the median rather than a fixed cut-off because its value in reads depends on the kit (Blondal et al. 2013 set a ΔCq above 7 for qPCR). Without both miRNAs in the table, a note takes the panel's place.
- Counts made from FASTQ
- Two more panels: what became of each sample's reads (too short or poor, miRNAs, each other RNA type, nothing known) and how long they were, with 21 to 23 bases shaded.
Default thresholds
- Significance
- Adjusted p-value < 0.05 (Benjamini-Hochberg).
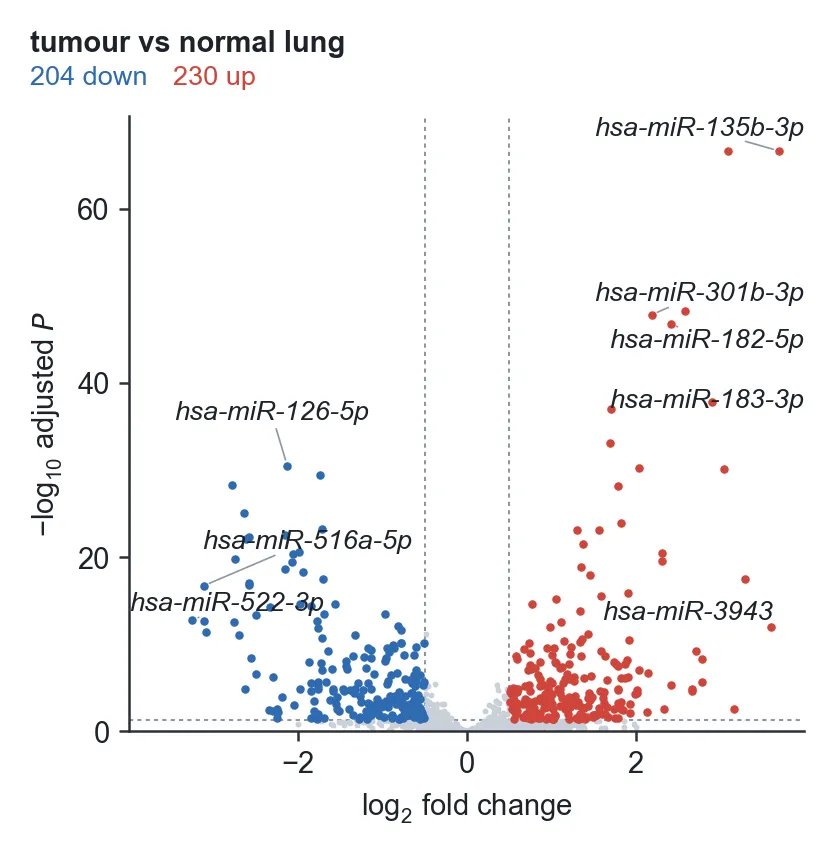
- Volcano and MA plots
- A miRNA is drawn as up or down with adjusted p < 0.05 and a log2 fold change of 0.5 or more either way (1.4-fold).
- Filter
- 5 or more counts in at least 2 samples.
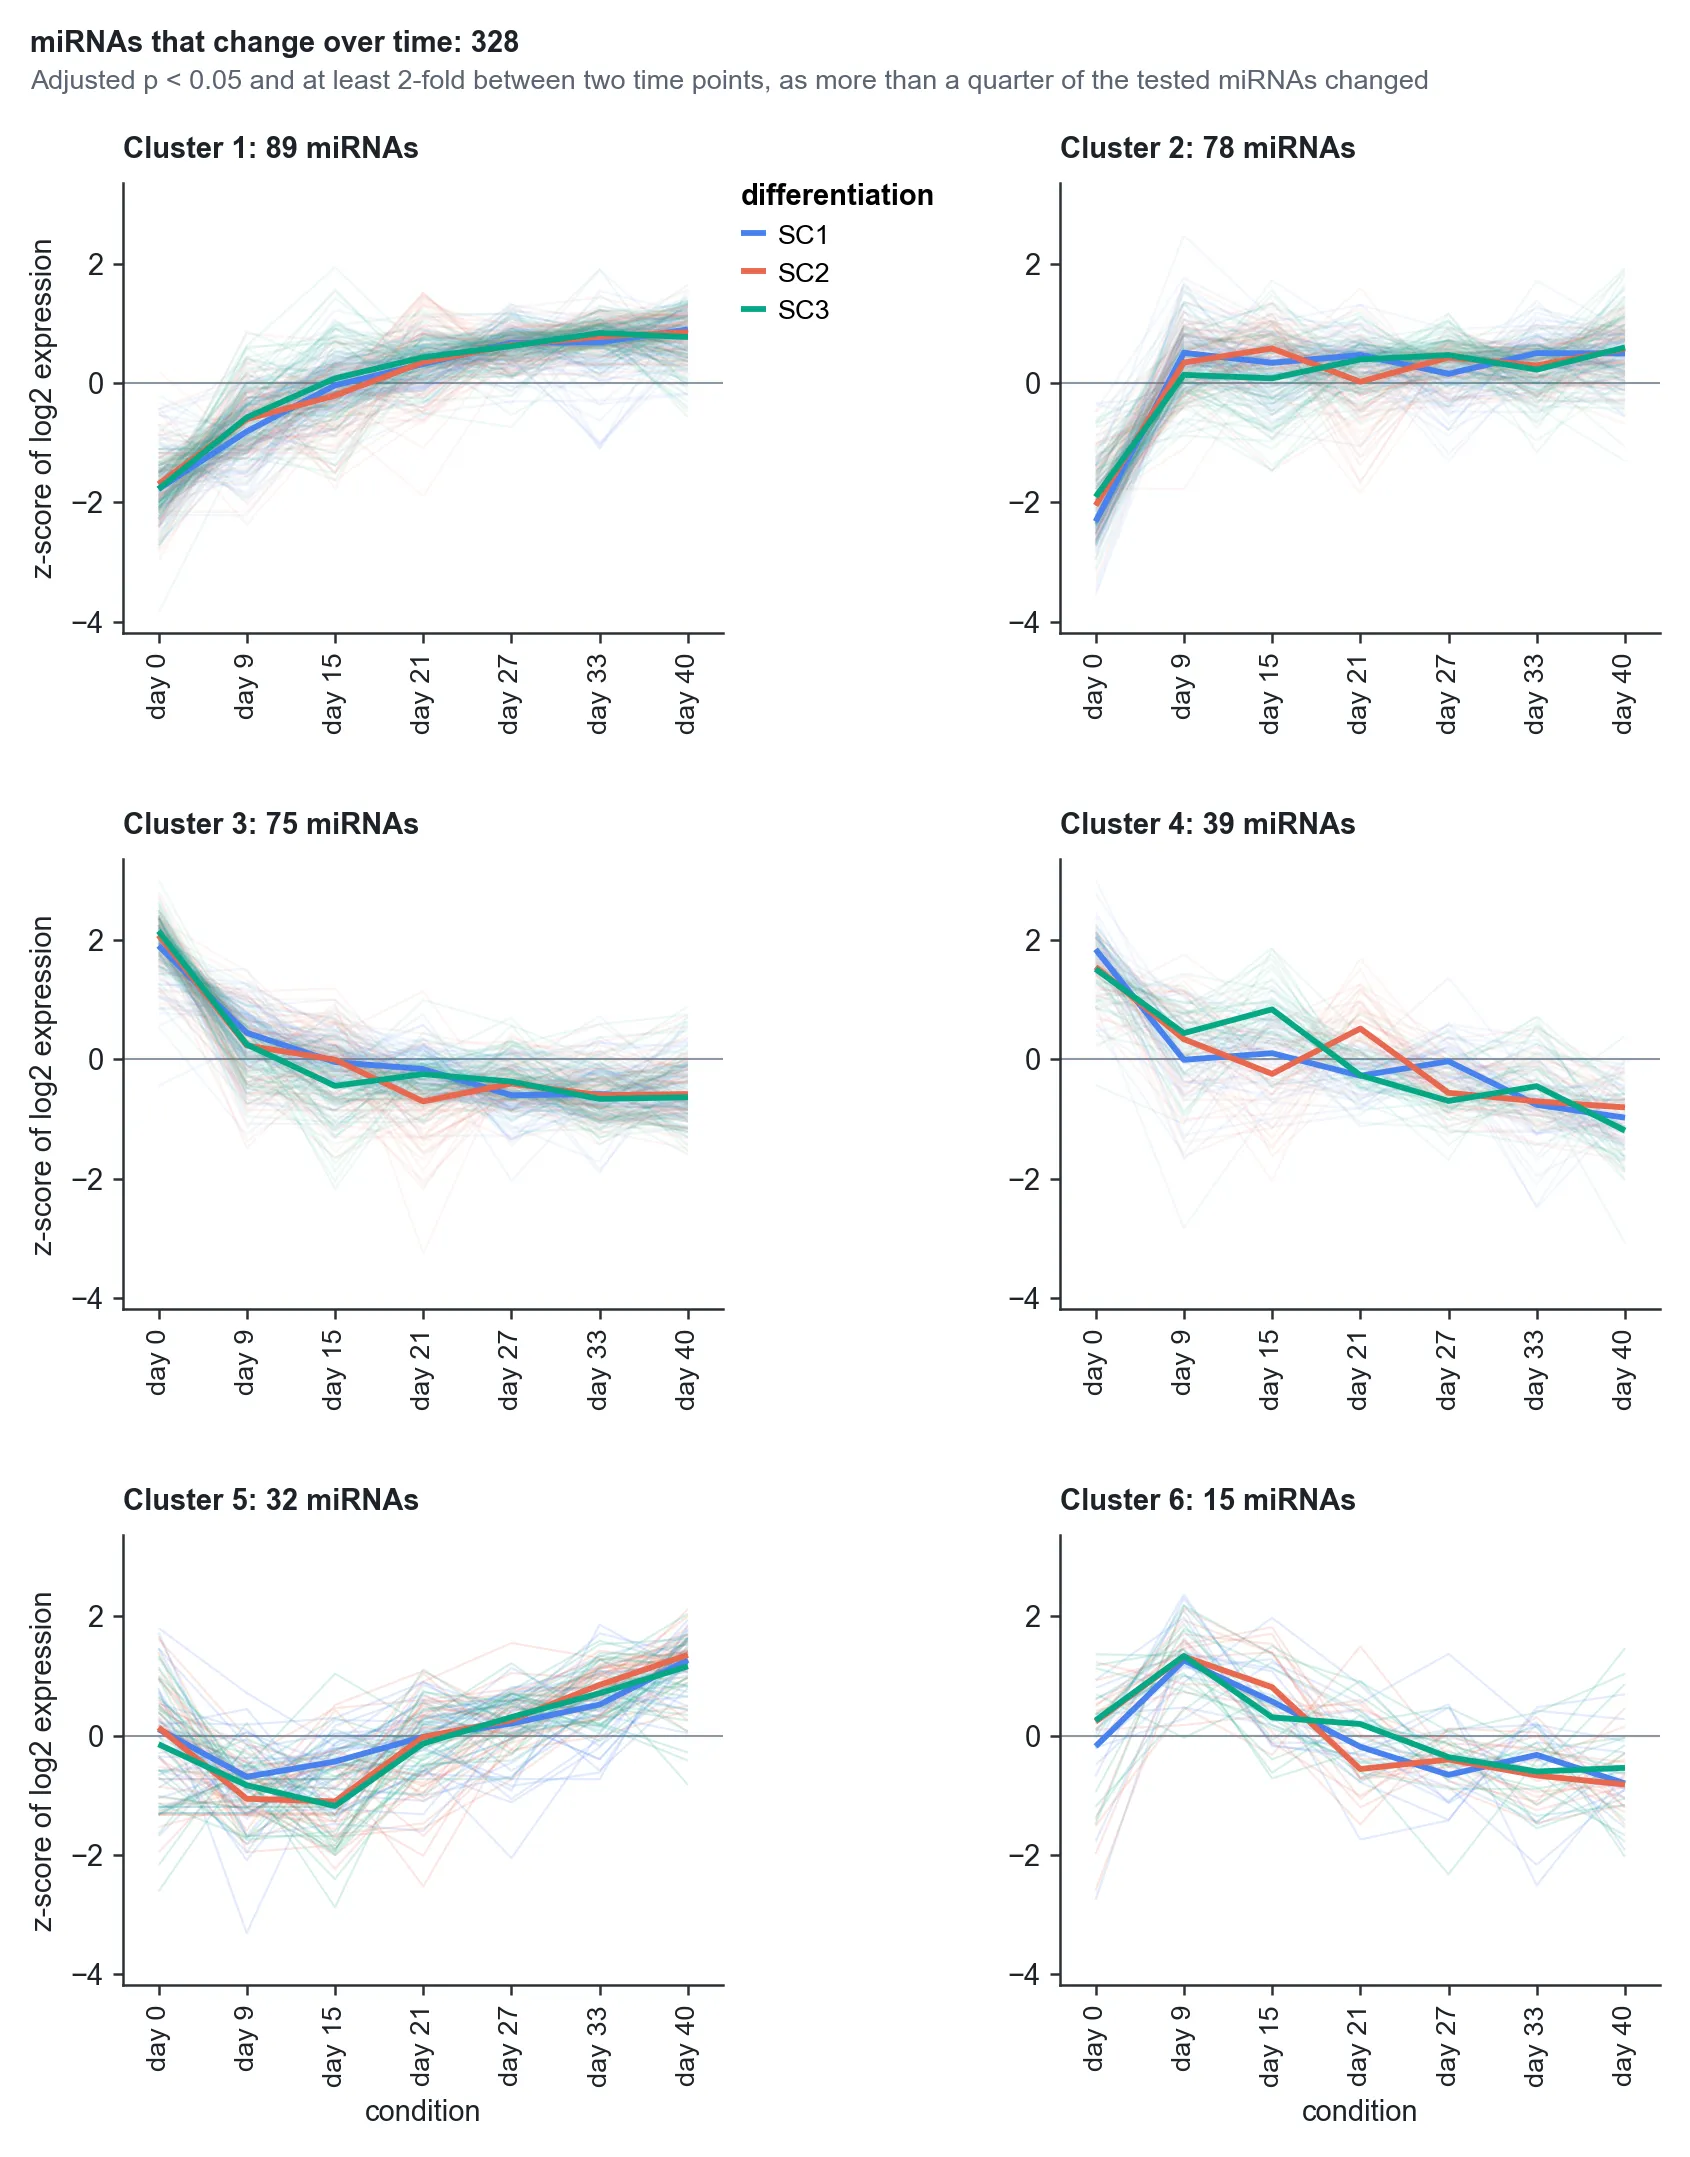
- Time Course
- Adjusted p < 0.05; when more than a quarter of the tested miRNAs change, also a 2-fold change between two time points.
Fold changes are not shrunk. A miRNA whose mean is too low for DESeq2 to test shows low counts, not tested, and the summary says how many were left out.
Sample datasets
Browse Sample Datasets in a small RNA-seq session lists four published studies, each from its count table in GEO:
- Plasma miRNAs in pulmonary arterial hypertension (GSE222022; Lago-Docampo et al. 2026): 10 patients and 10 healthy donors, RealSeq kit. Look at Library Quality first: the patients' libraries are shallower, and miR-451a holds about half of every sample's reads.
- Lung adenocarcinoma against normal lung (GSE110907; Yu et al. 2019): 24 women who never smoked, each with the tumour and the normal lung beside it, compared with patient in the design.
- miRNAs as stem cells become neurons (GSE244443; Soutschek et al. 2026): days 0 to 40, three differentiations, for Time Course. The table also counts piRNAs, snoRNAs and snRNAs.
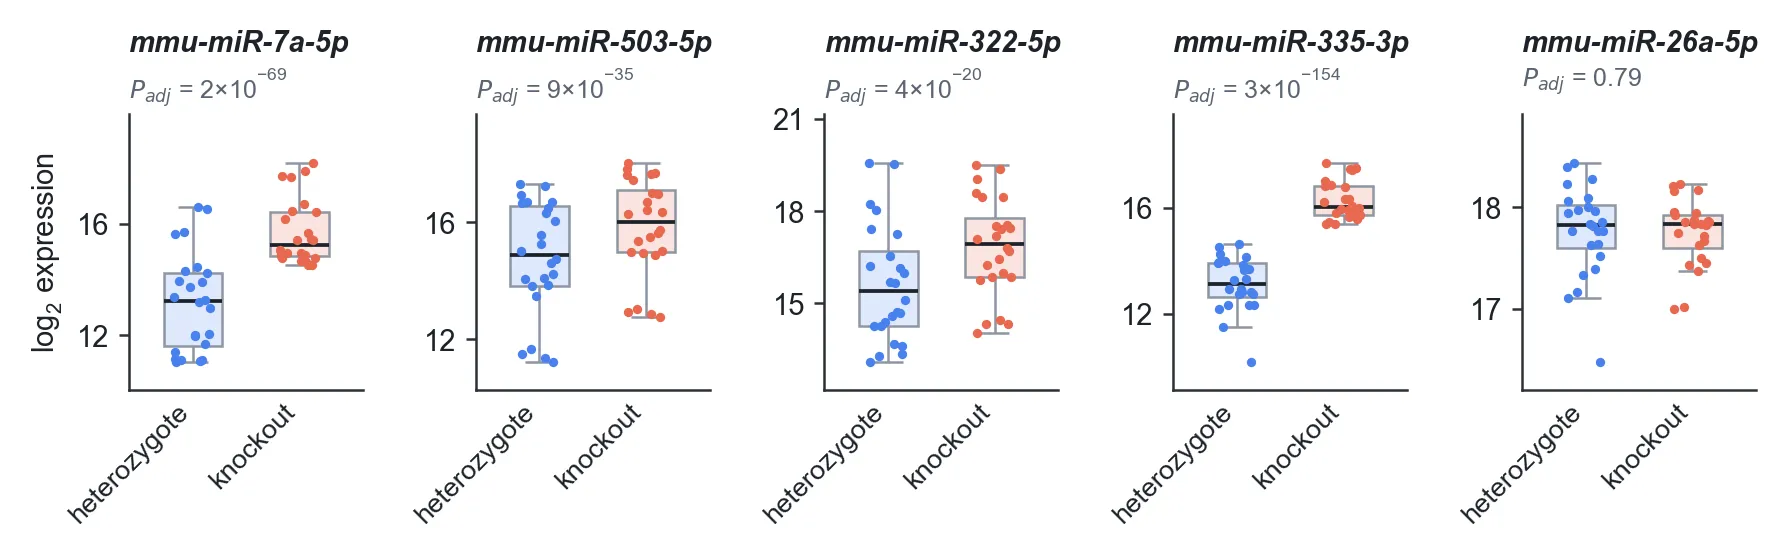
- Zswim8 knockout across mouse embryo tissues (GSE231448; Shi et al. 2023): knockouts and heterozygous littermates in 12 tissues, compared with tissue in the design.
Step reference
| Step | Stage | What it does | You get | Key inputs |
|---|---|---|---|---|
| Initial Plot | Setup | Reads your count tables, keeps the mature miRNAs as the data and every other small RNA apart, and shows each sample's miRNA reads, its reads by RNA type when the table counts more than miRNAs, and the 20 miRNAs with the most reads. | A DESeq2 dataset of miRNAs; the figure; tables of the samples, the conditions and what was read. | Count tables, counts made from FASTQ on baSeq, or a sample dataset. |
| Library Quality | QC | Checks each library: miRNA reads and miRNAs detected, the share of the reads in the top miRNA and the top ten, how many miRNAs hold the reads, and, for plasma and serum, hemolysis (miR-451a against miR-23a-3p). | A figure of four panels (six for counts made from FASTQ) and a table of every sample's numbers. | Detected with: 1, 5, 10 or 20 reads or more (5). Color by: a metadata column. |
| Filter Low miRNA Counts | QC | Removes the miRNAs with too few counts to test. | Each sample's counts kept and removed, and how many miRNAs were in the table, had counts and were kept. | None: a miRNA is kept with 5 or more counts in at least 2 samples. |
| Dispersion and Parameters | QC | Fits DESeq2's model per miRNA: size factors from the miRNAs alone, then dispersions. | Each sample's size factor against its counts, and the mean-dispersion plot. | None. The design comes from your metadata. |
| Sample to Sample Similarity | QC | Checks how similar the samples are, to spot outliers or mix-ups. | Pearson correlation and Euclidean distance heatmaps. | None. Groups the samples by condition. |
| Principal Component Analysis | QC | Shows the samples' overall structure in two dimensions. | PC1 against PC2 with each one's share of the variance. | The metadata column to color by. |
| Differential miRNA Expression | Analysis | Finds the miRNAs that differ between two groups of a design column, with DESeq2's Wald test; p-values adjusted by Benjamini-Hochberg. | A table of every miRNA (mean, log2 fold change, adjusted p-value) and a summary of what was compared. | A metadata column, the level to compare and the reference. Each needs at least 2 replicates. |
| Time Course | Analysis | Finds the miRNAs that change over time (DESeq2's likelihood ratio test) and groups them by the shape of their change. With one other factor in the design, also tests whether its groups' profiles differ, when they have replicates. | One panel per shape, and a table of every miRNA with its test, group and mean at each time point. | The column of time points: at least three, each with 2 replicates. |
| Heatmap | Analysis | Shows the miRNAs you name or describe across the samples. | A clustered heatmap of z-scored log2 expression, the samples in condition order. | Required: the miRNAs (miR-21-5p, miR-155-5p, or the miR-17~92 cluster); the conditions to include. |
| Boxplots | Analysis | Compares the miRNAs you name or describe between groups. | One panel per miRNA; with two conditions shown, Differential miRNA Expression's adjusted p-value in each. | Required: the miRNAs; the grouping column and its conditions. |
| Volcano Plot | Analysis | Each miRNA's log2 fold change against its adjusted p-value, one panel per level against the reference. | The volcano plot, the outermost miRNAs and any you ask for named. | Parameter to compare; the reference; one or more levels to compare with it. Optional miRNAs to name. |
| MA Plot | Analysis | Each miRNA's log2 fold change against its mean expression, one panel per level against the reference. | The MA plot, the top miRNAs and any you ask for named. | Parameter to compare; the reference; one or more levels to compare with it. |
| Custom plot | Analysis | Makes any plot you describe in plain English from your data. It only reads the data and never changes it. | The plot you described. | Required: a description of the plot. |
On the four sample datasets every step runs (Custom plot aside, whose code the model writes), and each study's finding comes back. Plasma in pulmonary arterial hypertension: let-7a-5p lower, and miR-9-5p, miR-31-5p and miR-3168 higher, in the patients (log2 −1.6, +4.9, +2.0 and +4.1), the three-miRNA panel and the candidate Lago-Docampo et al. report. Lung adenocarcinoma: miR-21 and the miR-183/96/182 cluster higher in the tumours (log2 +1.7 to +2.6), miR-126, miR-218 and miR-486 lower, and all seven miRNAs Yu et al. showed to slow lung cancer cells lower too (log2 −1.2 to −2.6). Neurons: miR-302a-3p falls about 120-fold over the 40 days and miR-218-5p rises 78-fold by day 9. Zswim8: miR-335-3p, miR-154-3p and miR-7a-5p rise 8.8-, 6.4- and 5.6-fold in the knockouts and miR-322-5p and miR-503-5p about twofold, as Shi et al. found.
Counting from FASTQ was checked on 33 public libraries of known kits (Giraldez et al. 2018, Wright et al. 2019 and GSE118125), every kit told right with nothing set. On Giraldez et al.'s synthetic pools, 286 miRNAs mixed in known ratios from 10:1 to 1:10, DESeq2's fold changes agree with the known ones (r = 0.996, slope 0.994, a median error of 0.11 log2), with 237 of the 247 changed miRNAs called and 1 of the 34 unchanged. Of the reads on miRNAs, 0.014 to 0.026% went to a miRNA not in the pools, against 0.042 to 0.94% with nf-core/smrnaseq's Bowtie settings.