
Figures
Put plots from your analyses together into a figure for a paper or a slide, set it up the way the journal wants, and export it.
Make a figure
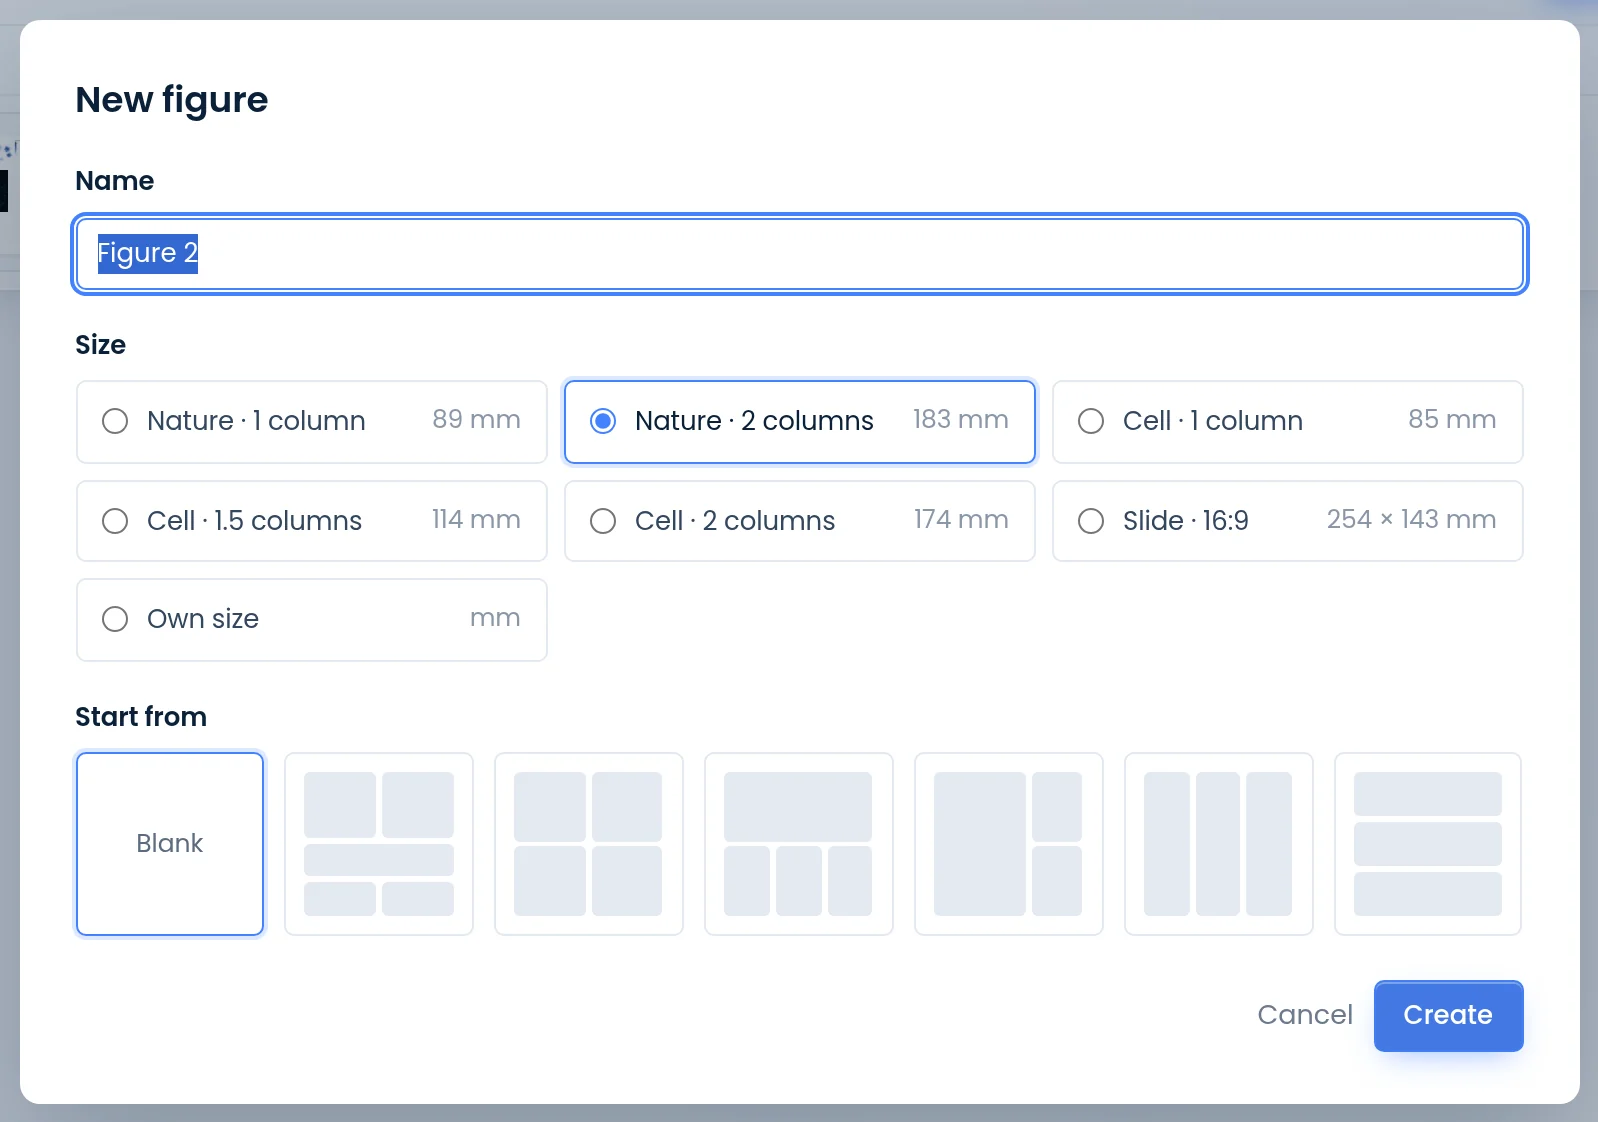
Figures, in the left menu, lists your figures with their size, how many panels they have and when they were last changed. Figures your lab shares with you are under From your lab. New figure asks for a name and a size: one or two columns of Nature, one, one and a half or two columns of Cell, a 16:9 slide, or a size of your own in mm. Start from a blank page or from a layout of empty places for plots. You can change the size later, at the top of the page.
Put plots on the page
The Plots column on the left lists the plots of the figure's project (This project), or of every analysis you can open, your lab's included (All projects). Click a plot, or drag it onto the page.
- A step that drew several panels shows its whole figure first, with each panel under it. The whole figure goes on the page as the step drew it, with one letter; Split into panels gives each panel its own.
- Images: add a micrograph, a gel or a drawing with the + tile, or drop the file on the page. PNG, JPEG, TIFF or WebP, up to 60 MB.
- Add to figure, in the spatial Explore workspace and on the flow cytometry gating screen, puts what you are looking at into a new figure or one of yours.
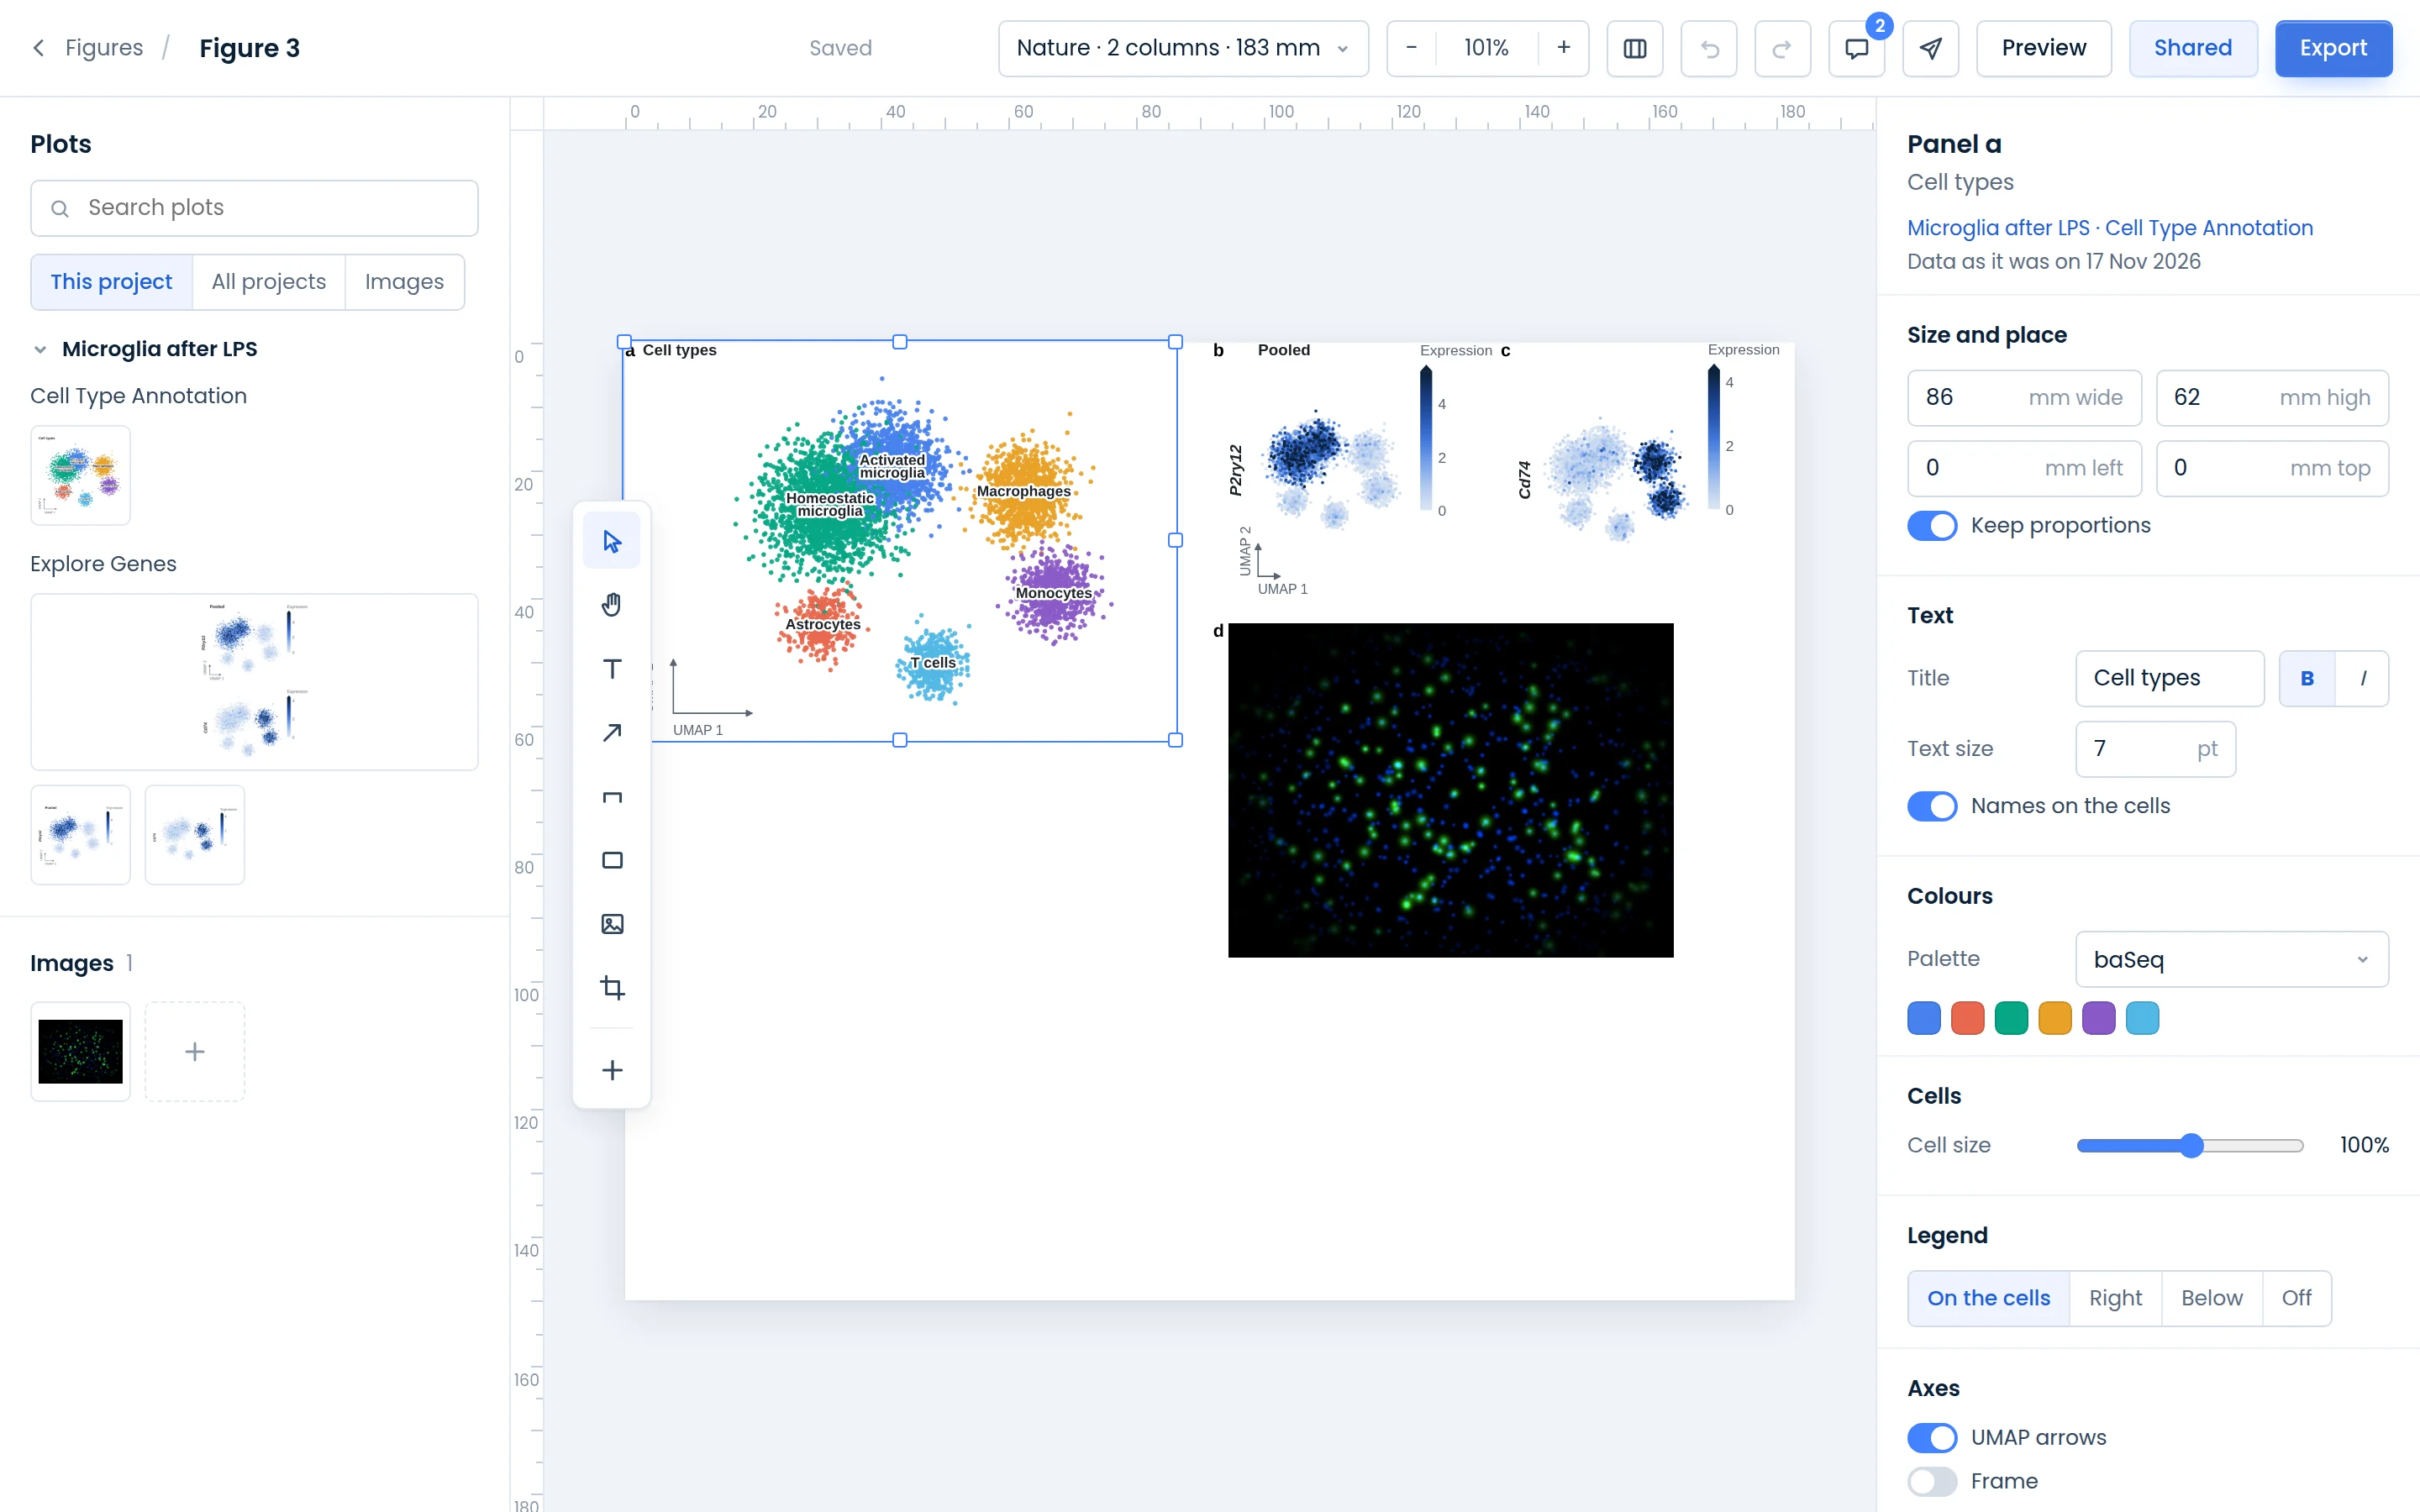
A panel keeps the data it was placed with: its settings say Data as it was on that day. Running the step again, or changing the analysis, leaves the figure as it is. To show a new result, place the plot again.
Each panel is drawn again at the size it has on the page, so its text keeps its size in points instead of shrinking with the panel. A plot baSeq cannot draw again, such as one made before Figures came to baSeq, goes in as a picture: you can move, resize and crop it, but not change its colours or text. Running its step again gives a plot you can change.
Arrange the page
- Drag a panel to move it, and its corners or sides to resize it. Guides show where it lines up with the page or another panel, and it snaps to them. Size and place, in the right column, sets it in mm.
- The letters follow reading order as you move panels.
- To choose several panels, hold Shift, Ctrl or ⌘ and click them, or drag a box over them from an empty part of the page. Ctrl or ⌘ and A chooses them all. Then use Align, Spread out, Same size or Put them in a layout. Delete removes them, and the arrow keys move them a little.
- Undo and redo are at the top, and the figure is saved as you work. The columns button shows the page alone.
Change how a panel looks
Click a panel to see its settings on the right. Only the settings that plot has are shown:
- Text: the title, in bold or italic if you like, the text size in points, and the names on the cells.
- Colours: a palette (baSeq, Okabe-Ito, Tableau 10 or Muted), and a colour of your own for any group.
- Cells: how large the cells are drawn. Lines: dotted, dashed or solid outlines, and how thick they are.
- Legend: on the cells, right, below or off. Axes: the UMAP arrows, and a frame.
Click an empty part of the page for the figure's own settings: its size, the panel letters (a b c, A B C or none) and their size, the font (Arial or Helvetica) and text size of every panel, the space between panels, and One colour for each group in every panel, so a cell type or a condition has the same colour wherever it appears.
Double-click a panel, or choose Edit elements, to change one thing inside it: drag a legend anywhere, retype or move the title or an axis name, or hide it. Put it back as the plot drew it undoes that. Crop (C) trims a panel's edges: Enter keeps the crop, and Escape leaves the panel as it was.
Notes, arrows and brackets
The tools beside the page add text (T), arrows (A), boxes (R) and brackets (B). One drawn on a panel moves with it, and goes when the panel is removed. A bracket joins two groups of a box plot and writes the P value the plot tested, as stars, or in your own words.
Export
Export makes one file of the whole page:
- PDF or SVG, with the text kept as text and the fonts embedded, as journals ask for;
- TIFF or PNG, at 300, 600 or 1200 dpi (in a PDF or SVG, the dpi is used for the dense dots of a scatter plot);
- PowerPoint: one 16:9 slide, with each panel as a picture and the letters and notes as text you can edit.
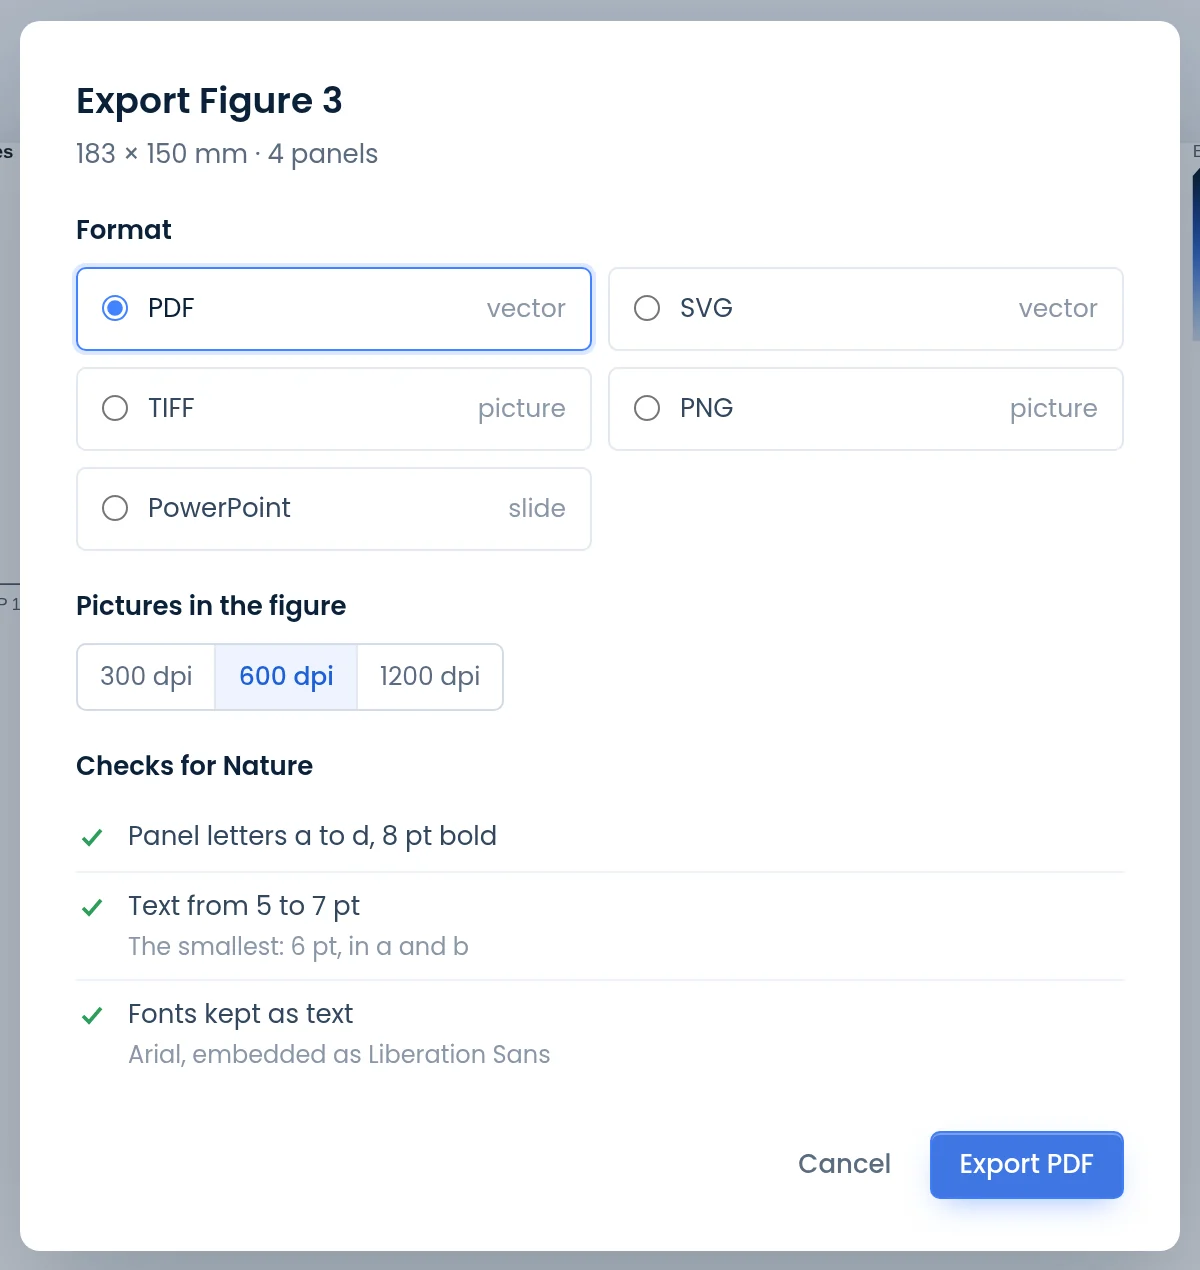
Before it exports, baSeq checks the figure against the journal you chose: the style of the panel letters (Nature uses a, b, c, Cell A, B, C), the text sizes (Nature 5 to 7 pt, Cell at least 6 pt), the fonts, pictures under 300 dpi, panels past the edge of the page or on top of each other, and a page wider than the journal's. It says where a problem is, and offers to change the letters. Preview shows the page without guides and frames.
Share with your lab
Share, at the top, shares the figure with your lab. Members find it under Figures, in From your lab, and on the lab's page. You choose what they can do:
- Read only: they look at it and export it.
- Can edit: they change it too, and add plots from analyses they can open. The lab's viewers can still only read it.
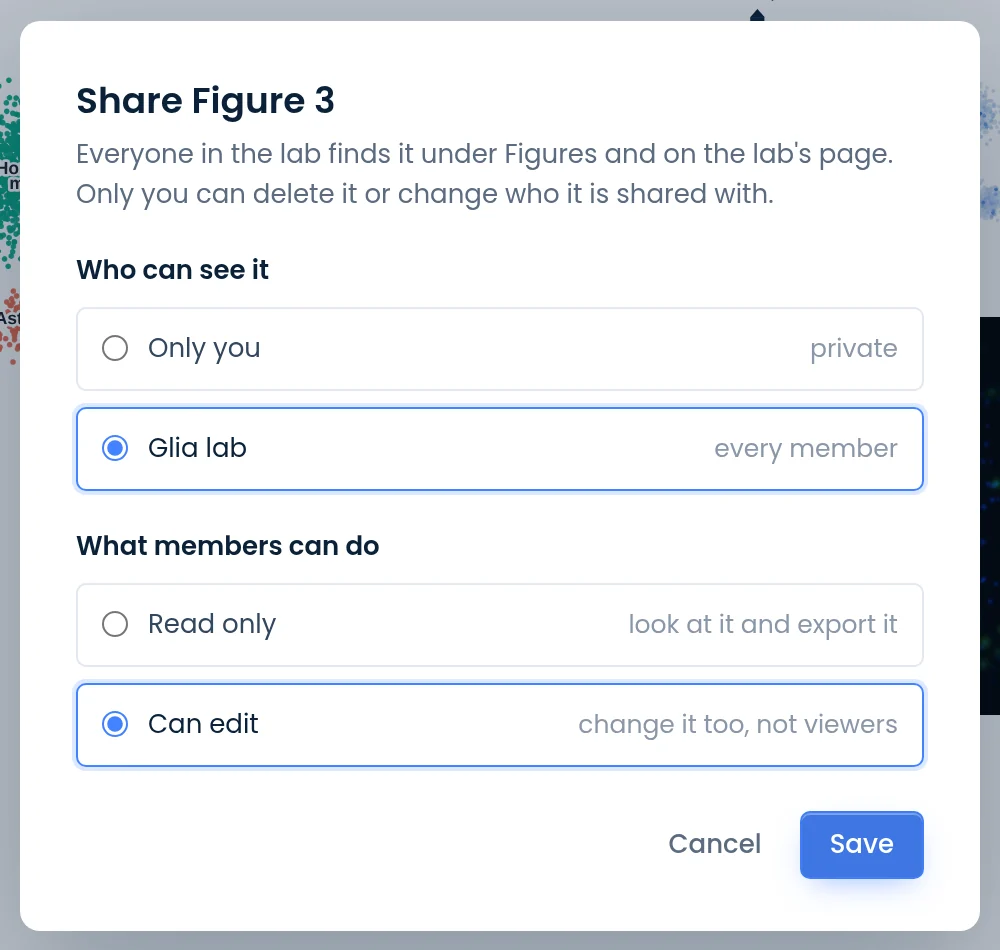
Only you can delete the figure or change who it is shared with. If two people change it at once, the later save is refused and asks for a reload, so nobody's work is overwritten. A shared figure shows its plots as they were placed, even when the analyses they came from are not shared. If someone leaves the lab, their figures become private again.
Comments
The speech bubble at the top opens the comments. Everyone who can open the figure reads them and can add one, about the whole figure or about one panel. A comment about a panel names it by its letter, and clicking that shows the panel on the page. Ctrl or ⌘ and Enter sends a comment.
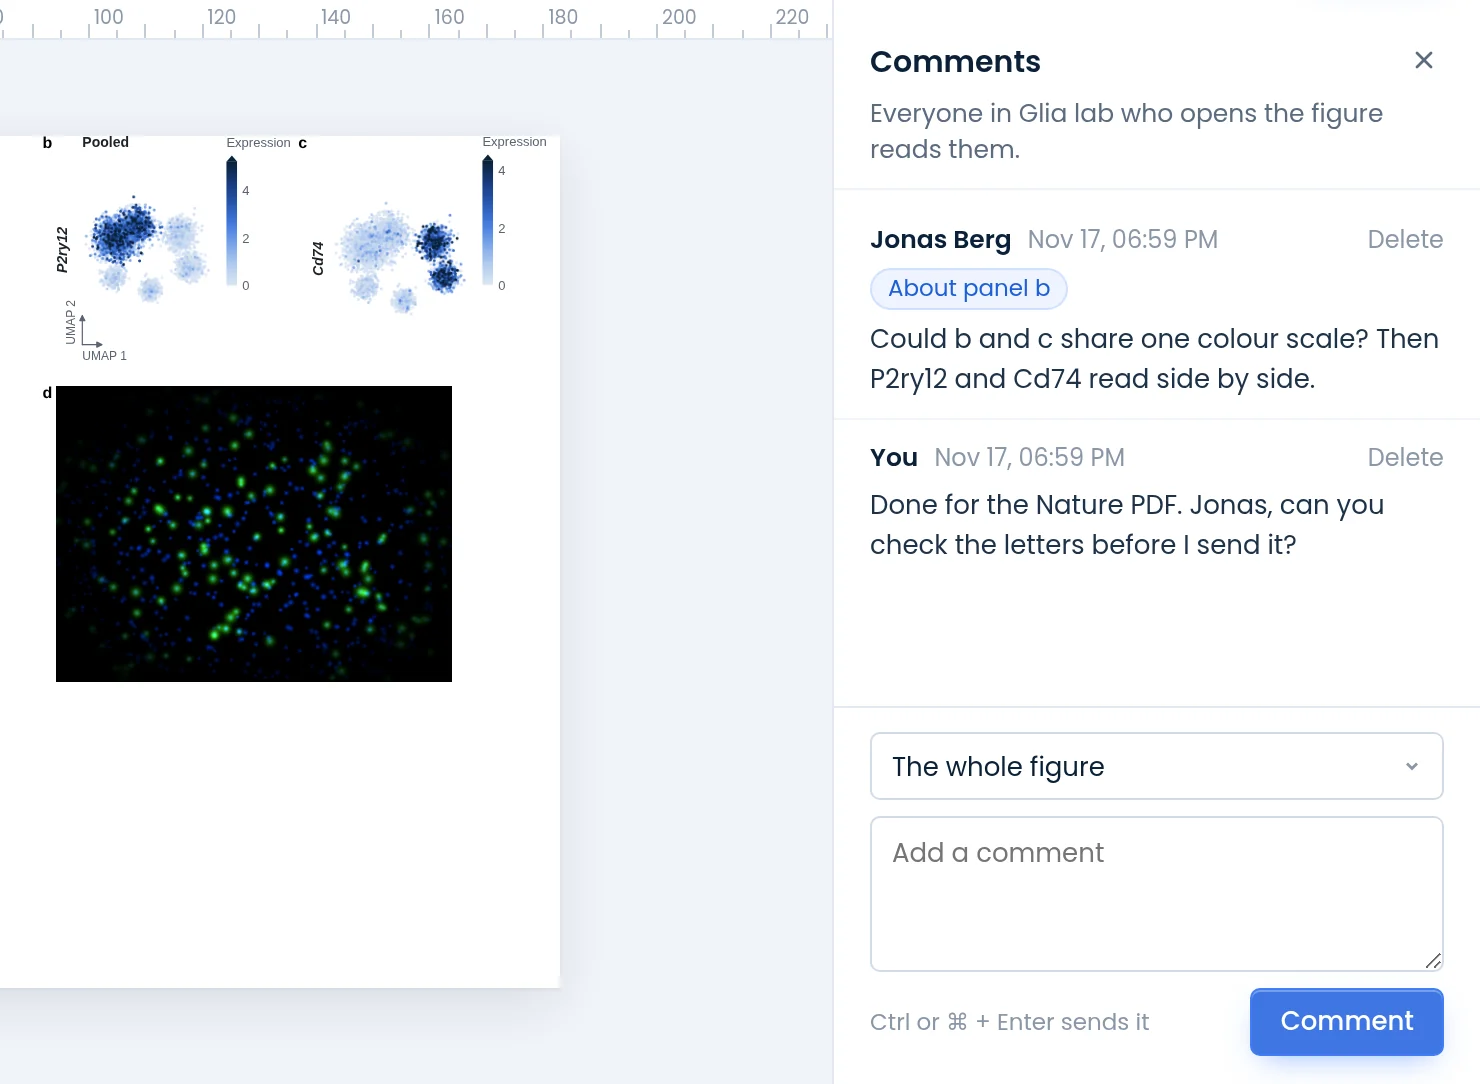
You can delete your own comments, and the figure's owner can delete any. The owner, and everyone who commented before, get an email about a new comment if comment emails are on in Account. The email says who commented on which figure, not what they wrote.
Send in Messages, the paper plane beside it, links the figure in one of your lab's conversations (see Messages). Each reader sees it only as far as they can open it.
Your figures and your data
- A figure keeps its own copies of the plots and images placed on it. Deleting a figure, from its row under Figures, deletes those copies with its exports and comments, at once. The analyses stay as they are.
- When you export your account's data, your figures' images come as you uploaded them, with your comments.